Pearson's chi square test (goodness of fit) | Probability and Statistics | Khan Academy
TLDRThe script details a potential restaurant buyer's approach to validate the owner's claim about customer distribution throughout the week. Suspicious of the provided percentages, the buyer conducts a hypothesis test using a chi-square statistic to determine if the distribution is accurate. With a significance level of 5%, they calculate expected customer numbers, compare them with observed data, and find a chi-square statistic of 11.44. This value exceeds the critical value of 11.07 for 5 degrees of freedom, leading to the rejection of the owner's distribution hypothesis. The buyer concludes that the distribution is not a good fit, suggesting the owner's data may be unreliable.
Takeaways
- 🍽️ The individual is considering buying a restaurant and seeks to validate the owner's claim about customer distribution throughout the week.
- ⚠️ The owner provides a distribution claiming 10% of customers visit on Monday and Tuesday, 15% on Wednesday, and so on, with the restaurant closed on Sunday.
- 📊 The individual decides to conduct an observational study to gather data on the actual number of customers visiting each day of the week.
- 🤔 Suspicion arises regarding the accuracy of the owner's distribution, prompting the need for a hypothesis test to validate the claim.
- 🧐 The null hypothesis (H0) is that the owner's distribution is correct, while the alternative hypothesis (H1) is that it is incorrect.
- 📉 A chi-square test is chosen to determine if the observed customer distribution significantly differs from the owner's claimed distribution.
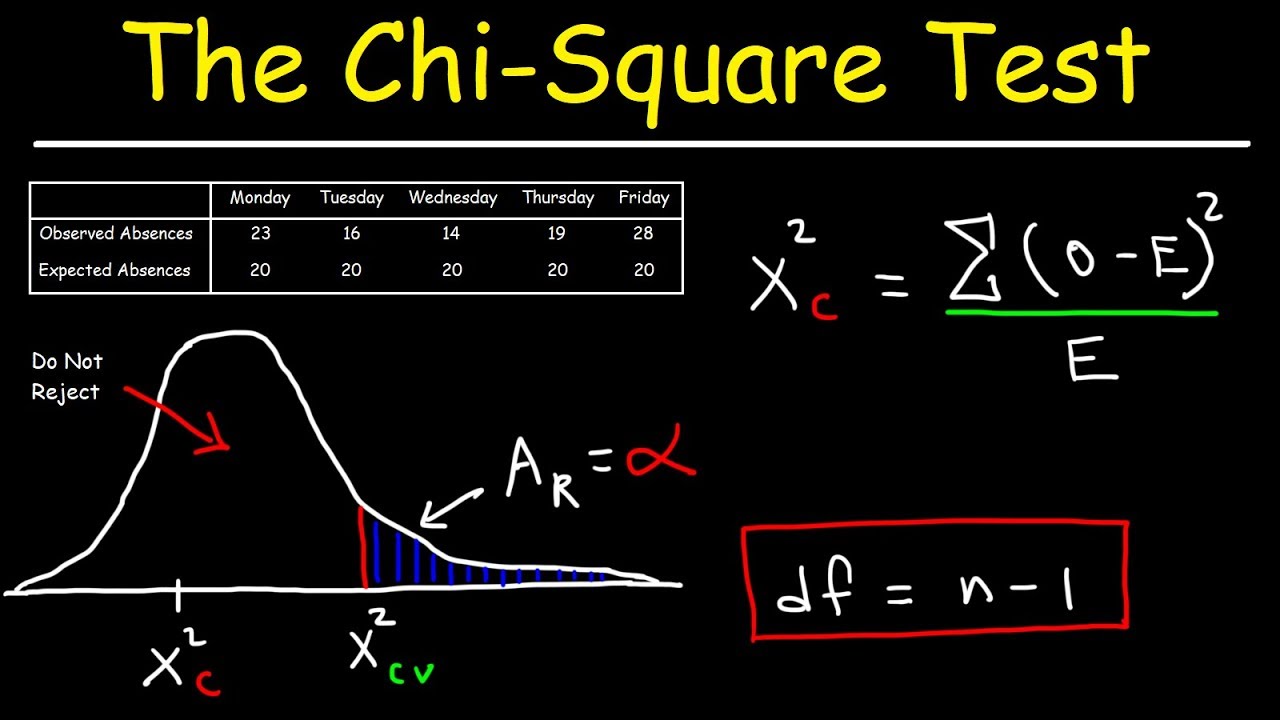
- 📚 The chi-square statistic is calculated using the formula: (observed - expected)^2 / expected for each day, summed across all days.
- 🔢 The expected number of customers for each day is determined based on the total number of customers observed for the week, proportionate to the owner's claimed percentages.
- 📈 The chi-square statistic is calculated to be 11.44, which is then compared to a critical value from the chi-square distribution table.
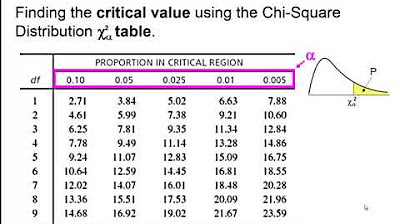
- 📊 The degrees of freedom for the test are determined to be 5 (number of days minus one), which is used to find the critical chi-square value from a statistical table.
- 📉 The critical chi-square value at a 5% significance level with 5 degrees of freedom is found to be 11.07.
- 🚫 Since the calculated chi-square statistic (11.44) is greater than the critical value (11.07), the null hypothesis is rejected, indicating the owner's distribution does not fit the observed data.
Q & A
What is the purpose of the chi-square test mentioned in the script?
-The chi-square test is used to determine whether a given distribution of observed data fits a theoretical distribution. In this case, it is used to test if the owner's distribution of customer visits throughout the week is accurate.
What is the null hypothesis in the context of this script?
-The null hypothesis is that the owner's distribution of customer visits is correct, meaning that the observed data should align with the expected percentages provided by the owner.
What is the alternative hypothesis in this scenario?
-The alternative hypothesis is that the owner's distribution is not correct, suggesting that the observed data does not align with the expected percentages and that the distribution should be rejected.
What is the significance level used in this chi-square test?
-The significance level used in this test is 5%, which means that if the probability of obtaining the observed data or more extreme data is less than 5%, the null hypothesis will be rejected.
How is the expected number of customers calculated for each day of the week?
-The expected number of customers for each day is calculated by taking the total number of customers for the week (200 in this case) and multiplying it by the expected percentage for that day (e.g., 10% for Monday, 15% for Wednesday, etc.).
What is the chi-square statistic and how is it calculated?
-The chi-square statistic is a measure used in the chi-square test to quantify the difference between observed and expected data. It is calculated by summing the squared differences between observed and expected values, each divided by the expected value.
What is the result of the chi-square statistic calculated in the script?
-The calculated chi-square statistic in the script is 11.44.
What are degrees of freedom in the context of a chi-square test?
-Degrees of freedom in a chi-square test refer to the number of independent pieces of information available to calculate the expected values. In this case, with six days of data and one total, the degrees of freedom are 5 (n - 1, where n is the number of categories).
How is the critical chi-square value determined?
-The critical chi-square value is determined by looking at a chi-square distribution table or using statistical software, using the degrees of freedom and the significance level (alpha) to find the value that corresponds to the desired probability.
What does the critical chi-square value of 11.07 mean in this context?
-The critical chi-square value of 11.07 means that there is a 5% chance of obtaining a chi-square statistic of 11.07 or higher if the null hypothesis is true. Since the calculated chi-square statistic is higher, it suggests that the observed data is significantly different from the expected distribution.
What conclusion is drawn from the chi-square test in the script?
-The conclusion drawn from the chi-square test is that the owner's distribution is not a good fit for the observed data, as the calculated chi-square statistic (11.44) is more extreme than the critical value (11.07), leading to the rejection of the null hypothesis.
Outlines
🤔 Evaluating Restaurant Customer Distribution
The speaker is considering purchasing a restaurant and begins by questioning the current owner about the daily customer distribution. The owner provides a distribution claiming 10% of customers visit on Monday and Tuesday, 15% on Wednesday, and so on, with the restaurant closed on Sunday. To verify the accuracy of this distribution, the speaker decides to conduct a hypothesis test using observed customer data collected throughout the week. The null hypothesis is that the owner's distribution is correct, while the alternative hypothesis is that it is not. The test will be conducted at a 5% significance level, and a chi-square statistic will be calculated to determine if the observed data fits the owner's claimed distribution.
📊 Calculating the Chi-Square Statistic
The speaker proceeds to calculate the expected number of customers for each day based on the owner's distribution, using a total of 200 customers observed over the week. The expected numbers are calculated as percentages of the total: 20 customers expected on Monday and Tuesday, 30 on Wednesday, 40 on Thursday, 60 on Friday, and another 30 on Saturday. The chi-square statistic is then computed by taking the difference between observed and expected numbers for each day, squaring these differences, and dividing by the expected numbers. The sum of these values gives the chi-square statistic, which is found to be 11.44 after performing the calculations.
📉 Interpreting the Chi-Square Test Results
With the chi-square statistic calculated, the speaker determines the critical chi-square value at a 5% significance level for 5 degrees of freedom, which is 11.07. The degrees of freedom are calculated as the number of categories minus one (in this case, 6 days minus Sunday's closure). The calculated chi-square statistic of 11.44 is compared to this critical value. Since 11.44 is greater than 11.07, it indicates that there is less than a 5% chance of observing such an extreme result if the owner's distribution were true. Therefore, the speaker concludes that the owner's distribution does not fit the observed data and decides to reject the null hypothesis, suggesting that the owner's distribution is not accurate.
Mindmap
Keywords
💡Restaurant
💡Distribution
💡Hypothesis Test
💡Null Hypothesis
💡Alternative Hypothesis
💡Significance Level
💡Chi-Square Statistic
💡Expected Observed
💡Degrees of Freedom
💡Critical Chi-Square Value
Highlights
The potential buyer is considering purchasing a restaurant and seeks to verify the owner's claim about customer distribution.
The restaurant owner provides a weekly customer distribution with percentages for each day, except Sunday when it's closed.
The buyer decides to conduct an observation to test the accuracy of the owner's customer distribution claim.
A hypothesis test is planned with a null hypothesis that the owner's distribution is correct and an alternative hypothesis that it is not.
The significance level for the hypothesis test is set at 5%.
The buyer will use a chi-square statistic to evaluate the fit of the observed data to the owner's distribution.
The chi-square statistic is calculated based on the difference between observed and expected customer numbers, normalized by the expected values.
The total number of customers observed in the restaurant for the week is 200.
Expected customer numbers are calculated based on the owner's distribution percentages applied to the total customer count.
The chi-square statistic is the sum of squared differences between observed and expected values, each divided by the expected number.
The calculated chi-square statistic for the observed data is 11.44.
The degrees of freedom for the chi-square test are determined to be 5, as one degree of freedom is lost for each expected value calculated.
The critical chi-square value at a 5% significance level with 5 degrees of freedom is 11.07.
The observed chi-square statistic of 11.44 is more extreme than the critical value, indicating that the owner's distribution is unlikely to be accurate.
Based on the hypothesis test, the buyer decides to reject the owner's claim about the customer distribution, as it does not fit the observed data.
Transcripts
Browse More Related Video
Elementary Statistics - Chapter 11 Chi Square Goodness of Fit Test
Chi Square Test
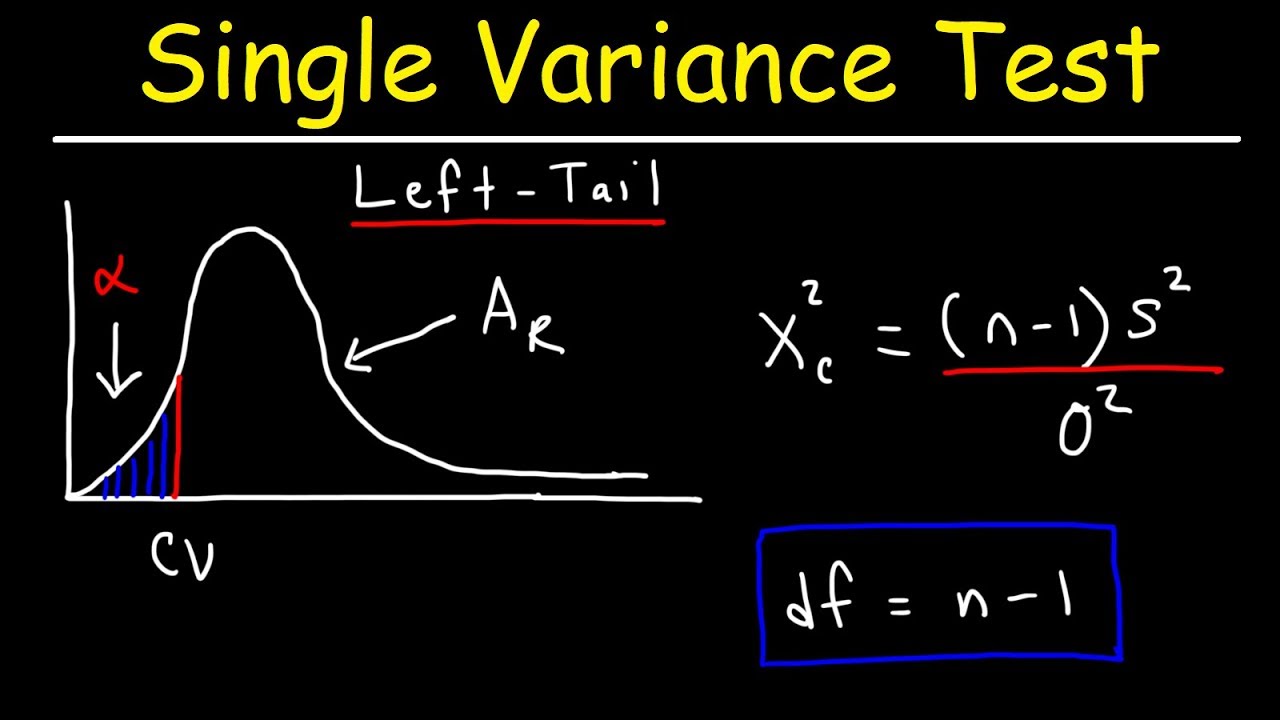
Chi Square Distribution Test of a Single Variance or Standard Deviation

Elementary Statistics Lesson #23A
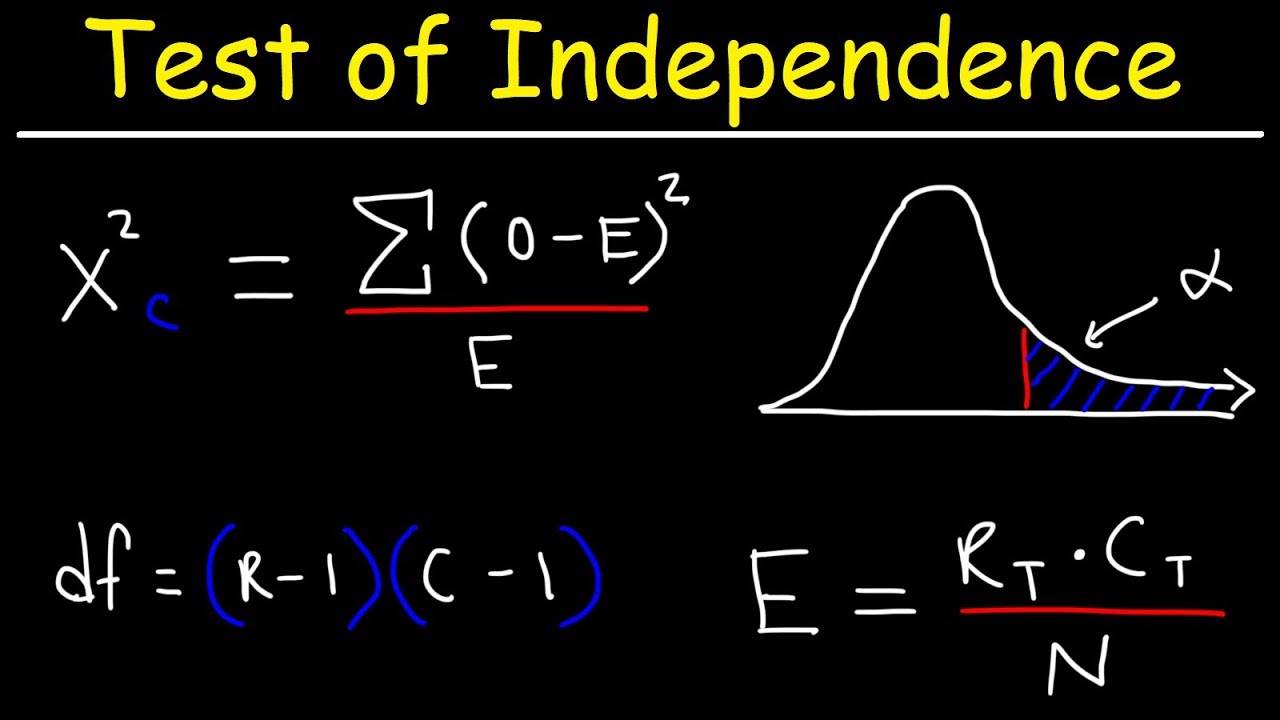
Test of Independence Using Chi-Square Distribution

Chi-square distribution introduction | Probability and Statistics | Khan Academy
5.0 / 5 (0 votes)
Thanks for rating: