MCR3U UNIT 5 Writing Sine Cosine Equation Given Graph
TLDRThis lesson teaches how to derive the equations for sine and cosine functions by analyzing a given graph. The instructor identifies key features such as crests at 5, minimums at -3, and the axis at y=1, leading to an amplitude of 4. The period is determined to be 180 degrees by examining points on the graph. Using this information, the K value is calculated as 2. The lesson demonstrates how to write equations for both sine and cosine functions, accounting for amplitude, period, phase shift, and vertical shift, with examples provided for each.
Takeaways
- 📚 The lesson's objective is to derive the equation for a sine or cosine function from a given graph.
- 🔍 The graph's maximum points, or crests, are at 5, indicating a key feature for determining the amplitude.
- 📉 The minimum points, or troughs, are at -3, -2, and -1, which helps calculate the total distance from maximum to minimum.
- 📏 The axis of the curve is midway between the crests and troughs, found to be at y = 1.
- 📐 The amplitude is the distance from the axis to the peak or trough, calculated to be 4 units.
- 🔁 The period of the function is determined by the distance between two crests or troughs, found to be 180 degrees.
- 🔢 The K value, which relates to the period, is calculated to be 2 by fitting two complete cycles within 360 degrees.
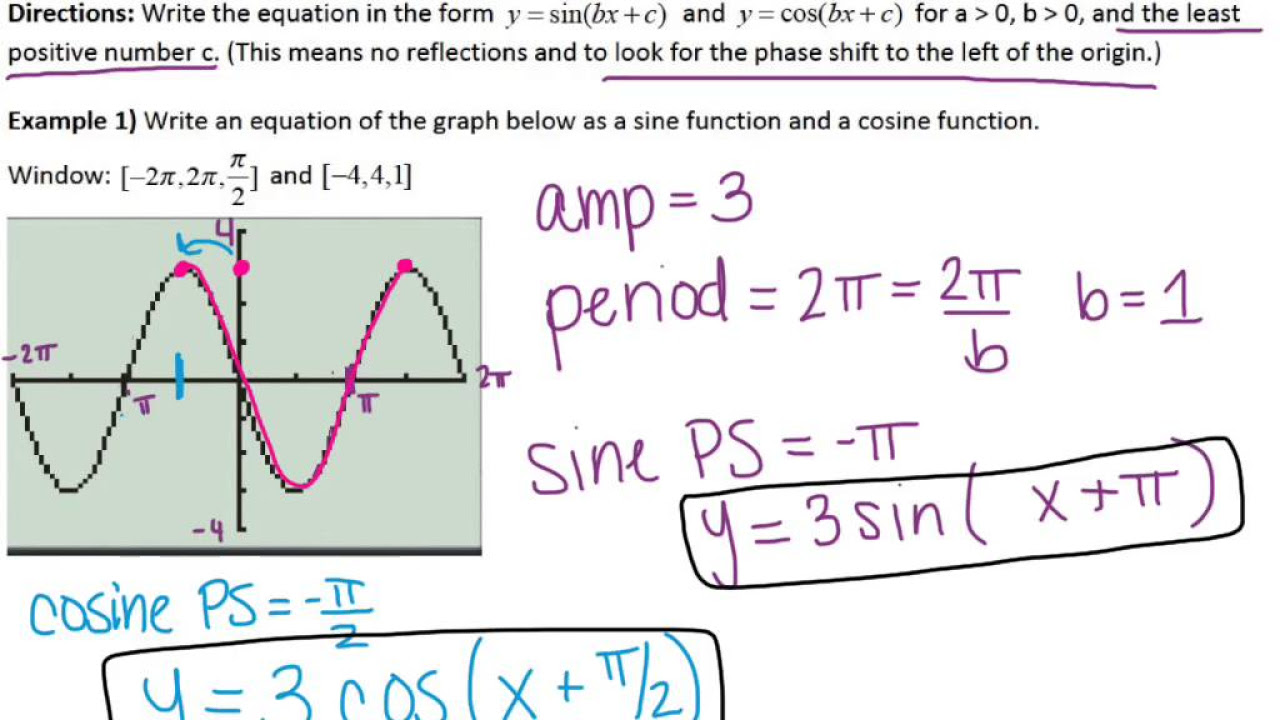
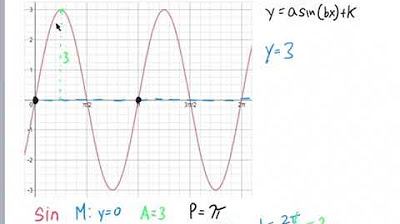
- 📈 The sine function starts on the axis and has a phase shift of 45 degrees to the right.
- 📉 The cosine function aligns with the zero point on the graph, indicating no phase shift and a direct match with the sine function's parameters except for the phase shift.
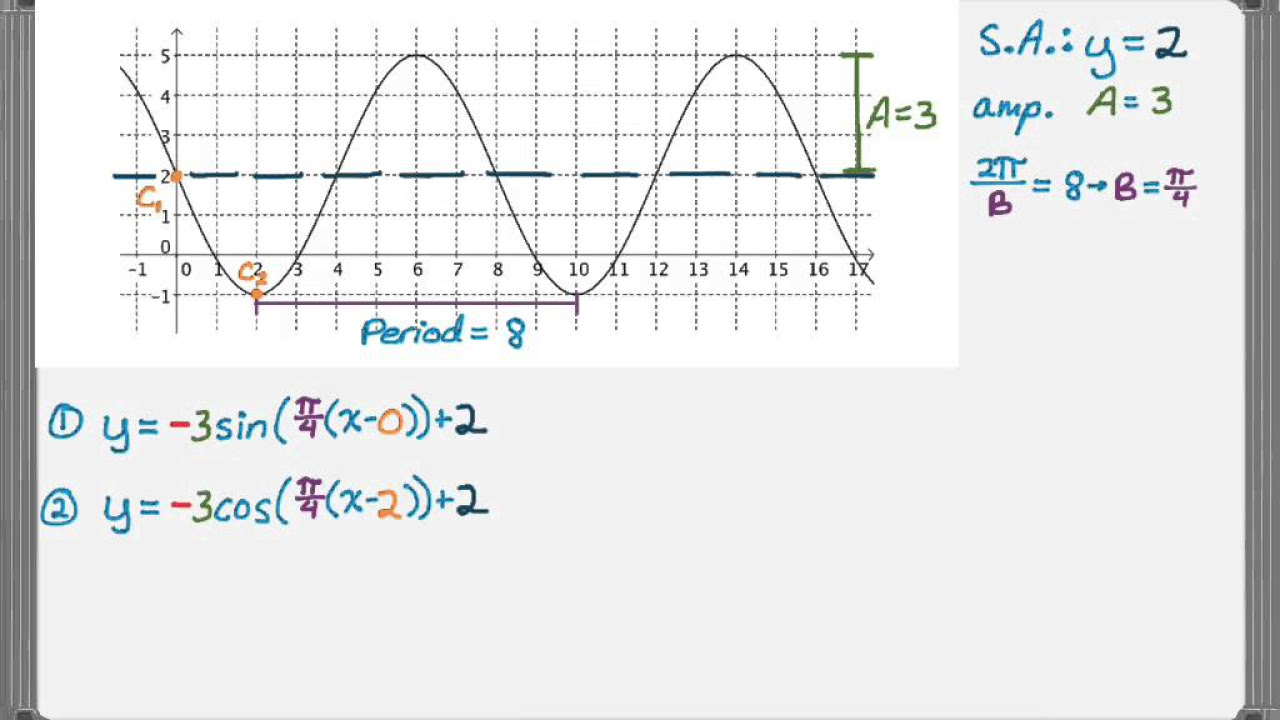
- 💡 The equation for the sine function includes a negative amplitude due to its downward opening, a phase shift of -45 degrees, a period determined by K=2, and an axis of y=1.
- 📝 The equation for the cosine function mirrors the sine function's parameters but without the negative amplitude and phase shift, maintaining the same axis of y=1.
Q & A
What is the main objective of the lesson in the provided transcript?
-The main objective of the lesson is to write the equation for a sine function and a cosine function that models the graph presented in the lesson.
What is the first step in analyzing the graph to determine the equation of the sine or cosine function?
-The first step is to identify the maximum points (crests) and minimum points (troughs) of the graph to determine the amplitude and the axis of the curve.
What is the amplitude of the graph in the lesson?
-The amplitude of the graph is four, which is the distance from the axis of the curve to either a maximum peak or a minimum trough.
How is the axis of the curve determined from the maximum and minimum points?
-The axis of the curve is determined to be exactly halfway between the crests and troughs, which in this case is at y equals one.
What is the total distance between the maximum and minimum points on the graph?
-The total distance between the maximum point at 5 and the minimum point at -3 is eight.
What is the period of the sine curve in the lesson?
-The period of the sine curve is 180, which is the distance between two crests or two troughs.
How can you determine the value of 'K' for the sine or cosine function?
-The value of 'K' can be determined by dividing 360 by the observed period length, which in this case gives a 'K' value of two.
What is the significance of the phase shift in the sine function equation?
-The phase shift indicates how much the sine function has been moved to the left or right on the graph. In the lesson, the sine function has been pushed over by 45 degrees.
How does the reflection of the sine function affect its equation in the lesson?
-The reflection of the sine function, which causes it to open downwards instead of upwards, is indicated by a negative sign in front of the sine function in the equation.
What is the equation of the sine function if it is pushed over by 45 degrees and opens downwards?
-The equation of the sine function in this case would be y = -4 * sin(2 * (theta - 45)) + 1.
What would be the equation of the cosine function for the given graph?
-The equation of the cosine function for the given graph would be y = 4 * cos(2 * theta + 1), assuming no phase shift and the same amplitude and axis as the sine function.
Outlines
📚 Analyzing Graph to Determine Sine and Cosine Equations
This paragraph discusses the process of deriving the equations for sine and cosine functions based on a given graph. The speaker begins by identifying the maximum and minimum points of the graph, which are at 5 and -3 respectively, leading to an amplitude of 4 and an axis at y=1. The total distance between these points is 8. The period of the function is determined by the distance between two crests or troughs, which is found to be 180 degrees. The speaker then explains how to calculate the K value, which is 2 in this case, by dividing 360 degrees by the observed period. This information is crucial for writing the equations of the sine and cosine functions that model the graph.
🔍 Writing Sine and Cosine Functions for a Given Graph
In this paragraph, the focus shifts to writing the actual sine and cosine functions for the graph analyzed in the previous section. The speaker chooses a specific sine function on the graph that has been shifted by 45 degrees and opens downwards. The equation for this sine function is derived by incorporating the amplitude (negative due to the downward opening), the K value (2), the phase shift (-45 degrees), and the vertical shift (+1). This results in the equation y = -sin(2θ - 45) + 1. For the cosine function, the speaker identifies a function on the graph that aligns with the zero line, indicating no phase shift. The cosine function shares the same amplitude and axis as the sine function but does not have a phase shift or reflection. The resulting equation is y = cos(2θ) + 1. The speaker emphasizes that there are multiple solutions for both sine and cosine functions that could model the graph.
Mindmap
Keywords
💡Sine Function
💡Cosine Function
💡Amplitude
💡Axis
💡Period
💡Crest
💡Trough
💡Phase Shift
💡K Value
💡Graph Analysis
Highlights
The lesson focuses on deriving the equation for a sine or cosine function from a given graph.
The graph's crests (maximum points) are identified at y=5.
The graph's minimum points are observed at y=-3.
The total distance between the maximum and minimum points is 8, indicating the amplitude.
The axis of the curve is determined to be halfway between the crests and troughs at y=1.
The amplitude is calculated as 4, the distance from the axis to the peak or trough.
The period of the sine curve is analyzed and determined to be 180 degrees.
Exact points on the graph are revealed to gather information about the period.
The K value, based on the period, is calculated to be 2.
The process of determining the K value by dividing 360 by the observed period is explained.
The sine function is assumed for the equation derivation, with the graph analyzed for a starting point.
A sine function is identified starting at the axis and moving down and back up.
The sine function is noted to be shifted by 45 degrees to the right.
The equation of the sine function is derived with a negative amplitude due to reflection.
The cosine function is identified on the graph, with no phase shift.
The equation for the cosine function is written with a positive amplitude and no phase shift.
Multiple solutions for both sine and cosine functions are acknowledged.
Transcripts

5.0 / 5 (0 votes)
Thanks for rating: