Writing Sine and Cosine Equations from Graphs
TLDRThis educational video tutorial focuses on deriving the equations of sine and cosine functions from their graphs. It introduces the sinusoidal axis, amplitude, period, and phase shift, explaining how to identify these elements from a graph. The amplitude is the absolute value of 'a', found by the distance from the sinusoidal axis to the maximum or minimum. The period is calculated using 2π divided by 'B', and the phase shift is determined by the starting point 'C'. The video illustrates how to apply these concepts with examples, including handling unusual periods by counting multiple cycles and dividing. It also emphasizes the importance of recognizing the pattern of sine and cosine functions based on the sign of 'a', to correctly formulate the equations.
Takeaways
- 📚 The video discusses how to find trigonometric equations for sine and cosine graphs.
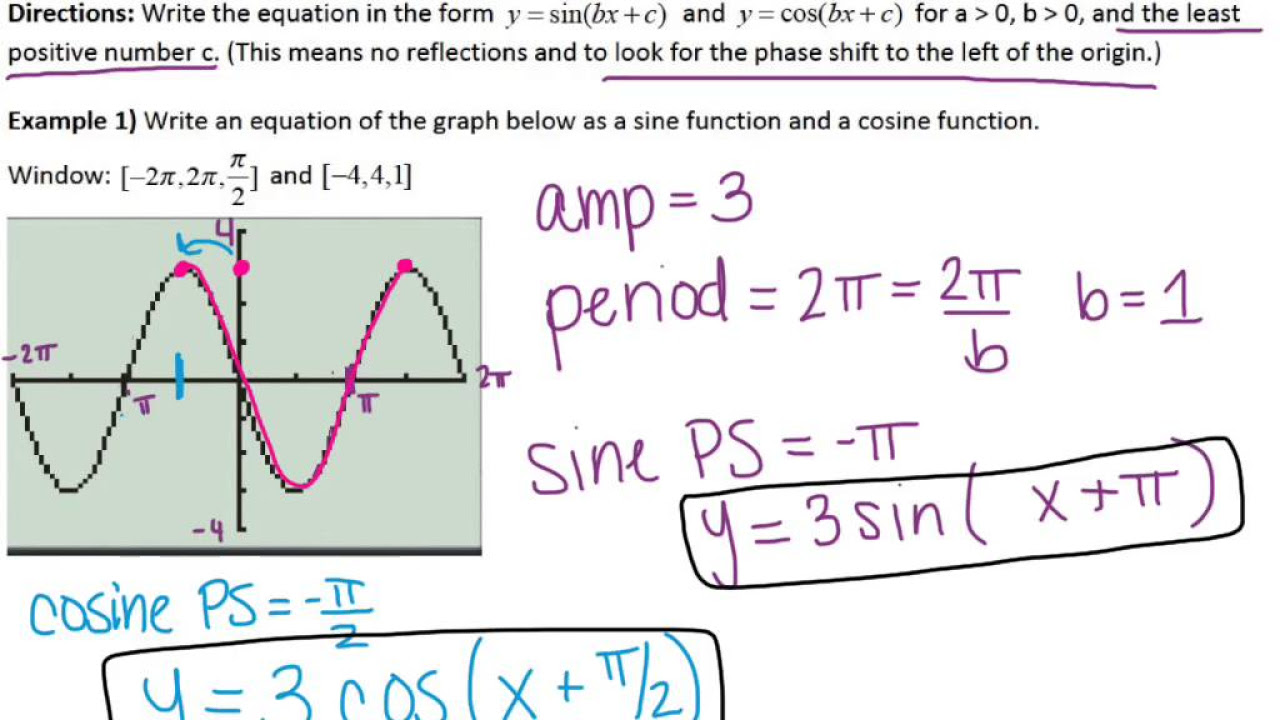
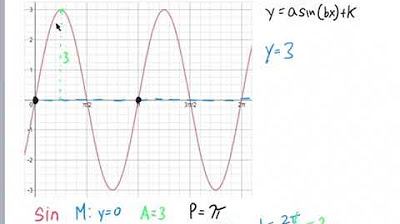
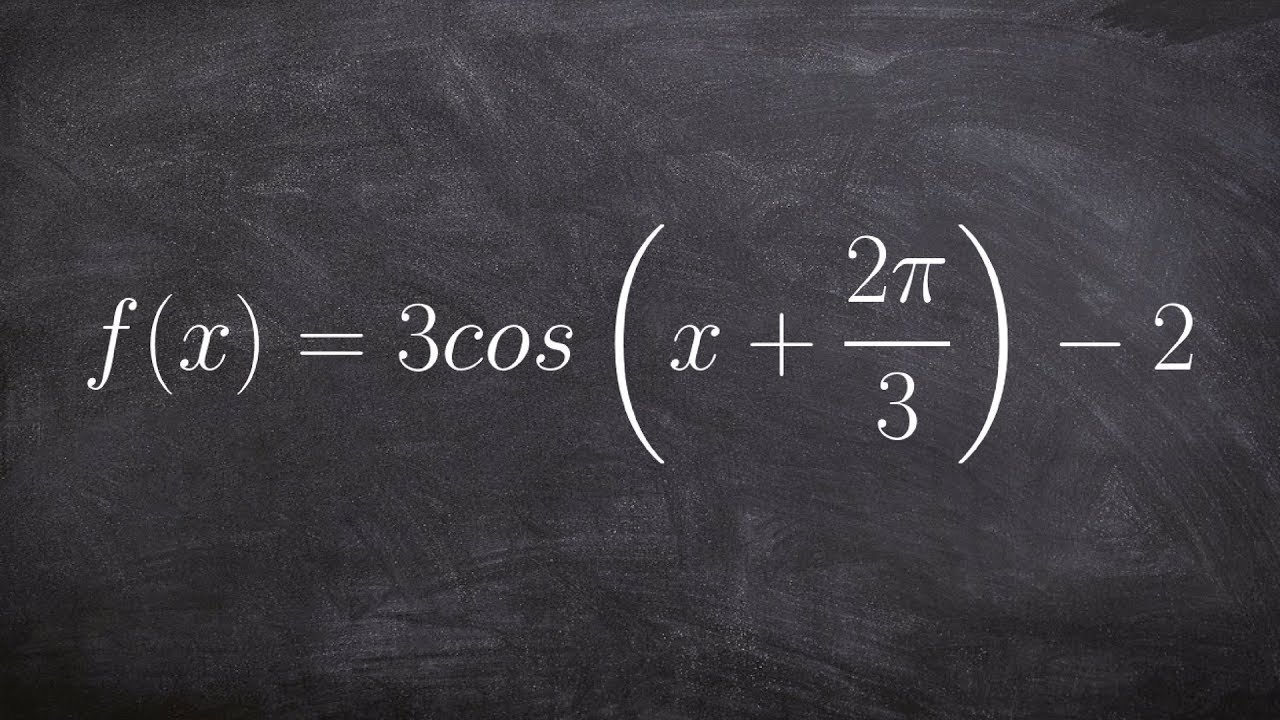
- 🔍 The general form of the equation is y = a * sin(B(x - C)) + D, where a, B, C, and D are constants.
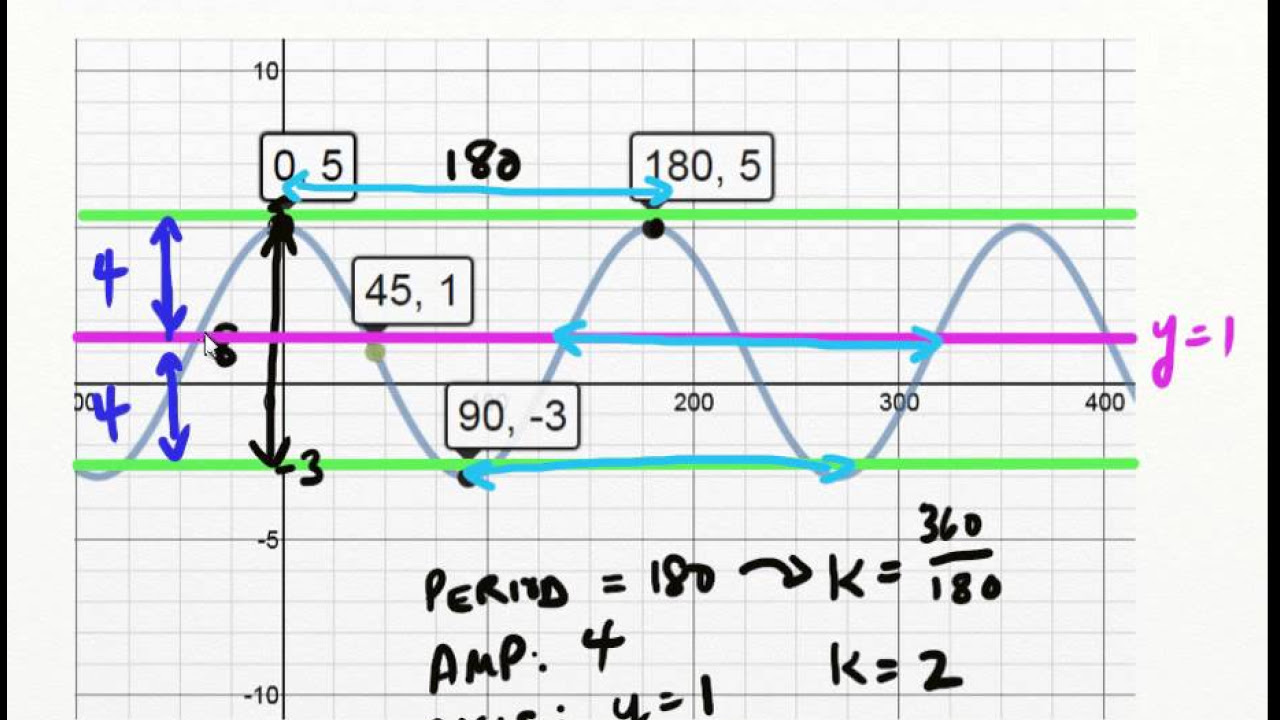
- 📏 The 'sinusal axis' (D) is found by looking at the midpoint of the graph's maximum and minimum values.
- 🔑 Amplitude (a) is the absolute value of a and can be found by calculating half the distance between the maximum and minimum of the graph.
- 🌀 The period of the graph is found by determining the length of one complete cycle and using the formula 2π / B.
- 🔢 To find B, solve for it using the period of the graph, which is derived from the formula 2π / B.
- 📍 The starting point (C) is chosen based on the x-intercept or can be given in the problem.
- 🔄 The sign of a determines the pattern of the graph; if a > 0, it follows the pattern intercept-maximum-intercept-minimum, and if a < 0, it's the reverse.
- 📉 For cosine, if a > 0, the graph starts at a maximum, and if a < 0, it starts at a minimum.
- 📈 The video includes examples of how to apply these concepts to a given graph to derive the equation.
- 🔄 When the period is not straightforward, count multiple periods and divide to find the value of B, as demonstrated in the video.
Q & A
What is the general form of a trigonometric equation for sine and cosine functions?
-The general form of a trigonometric equation for sine and cosine functions is y = a * sin(B * (x - c)) + d or y = a * cos(B * (x - c)) + d, where 'a' is the amplitude, 'B' determines the period, 'c' is the phase shift, and 'd' is the vertical shift.
What is the sinusoidal axis in the context of trigonometric graphs?
-The sinusoidal axis, also known as the midline, is the horizontal line that represents the average value of the maximum and minimum of the sine or cosine function graph, which corresponds to 'd' in the equation y = a * sin(B * (x - c)) + d or y = a * cos(B * (x - c)) + d.
How do you find the amplitude of a sine or cosine function from its graph?
-The amplitude is the absolute value of 'a' and can be found by calculating the distance from the sinusoidal axis to the maximum or minimum point of the graph, or by finding half the distance between the maximum and minimum points.
What is the formula to calculate the period of a sine or cosine function?
-The period of a sine or cosine function is calculated using the formula 2π divided by the absolute value of 'B', which is 2π/|B|.
How can you determine the value of 'B' from the graph of a sine or cosine function?
-To determine 'B', you can measure the period of the function from the graph (the distance from one maximum to the next, or one minimum to the next), and then use the formula B = 2π / period.
What is the starting point 'c' in the equation of a sine or cosine function?
-The starting point 'c' in the equation represents the phase shift of the function and is the value of 'x' where the function starts its cycle from an intercept.
How does the sign of 'a' affect the pattern of a sine or cosine graph?
-If 'a' is positive, a sine graph will go from an intercept to a maximum to an intercept to a minimum, and a cosine graph will start at a maximum. If 'a' is negative, the patterns are reversed: sine goes from an intercept to a minimum to an intercept to a maximum, and cosine starts at a minimum.
What is the significance of the intercept in determining the starting point 'c' for a sine or cosine function?
-The intercept is the point where the graph crosses the sinusoidal axis. It is used to determine the starting point 'c' because it indicates where the function begins its cycle.
How can you verify if the equation you derived for a sine or cosine graph is correct?
-You can verify the derived equation by checking if moving over one full period (as calculated) brings you back to the starting point of the pattern, ensuring that the graph completes a full cycle.
What is an increment in the context of a sine or cosine function with a non-standard period?
-An increment refers to the division of the period into equal parts, typically four, which helps in identifying the pattern of the function and in finding the correct starting points for different cycles.
Can you provide an example of how to find the sinusoidal axis from a given graph?
-Yes, to find the sinusoidal axis, you can look at the graph and identify the average of the maximum and minimum values, or you can calculate it as (maximum + minimum) / 2.
Outlines
📚 Introduction to Finding Trig Equations from Graphs
The video begins with an introduction to the process of deriving trigonometric equations, specifically sine and cosine, from their graphs. The general form of the equation is discussed, which includes the sinusoidal axis (y = D), amplitude (A), period (2π/B), and phase shift (x = C). The amplitude is the absolute value of A and can be found by calculating the distance from the sinusoidal axis to the maximum or minimum points. The period is determined by the distance between two consecutive maximum or minimum points, and B is solved using the formula 2π/B. The starting point or phase shift is identified as x = C. The video also discusses the significance of the sign of A in determining the pattern of the sine and cosine waves.
🔍 Detailed Steps for Deriving Trigonometric Equations
This paragraph delves into the detailed steps for deriving the trigonometric equations from a given graph. It starts with identifying the sinusoidal axis, which can be found by averaging the maximum and minimum values of the graph. The amplitude is then calculated as the distance from the sinusoidal axis to the maximum or minimum points. The period is determined by counting the distance from one maximum or minimum to the next, or by counting the pattern of the graph. The formula for the period is 2π/B, and B is solved accordingly. The phase shift is identified by the starting point on the y-axis. The video also explains how to adjust the equation for different starting points and patterns, including changing from sine to cosine and vice versa, by altering the sign and the starting point.
Mindmap
Keywords
💡Trig Equations
💡Sine (sin)
💡Cosine (cos)
💡Sinusoidal Axis
💡Amplitude
💡Period
💡Phase Shift
💡Starting Point
💡Increment
💡Pattern Recognition
💡Graph Analysis
Highlights
Introduction to the process of finding trigonometric equations from graphs specifically for sine and cosine functions.
Explanation of the general form of a trigonometric equation: y = a * sin(B * (x - c)) + d.
Identification of the sinusoidal axis as y = D, which is the average of the maximum and minimum of the graph.
Amplitude is the absolute value of a and can be found using the distance from the sinusoidal axis to the maximum or minimum.
Period calculation using the formula 2π divided by B, where B is determined from the graph.
Method to find the period by counting from maximum to maximum or minimum to minimum, or by recognizing the pattern.
The importance of the starting point, x = c, in determining the phase shift of the trigonometric function.
Different patterns for sine and cosine based on the sign of a, affecting where the graph starts from an intercept or a maximum/minimum.
Demonstration of how to determine the sinusoidal axis, amplitude, period, and starting point using a given graph.
Using the graph to find specific values for D, amplitude, and period to construct the trigonometric equation.
Strategy for choosing starting points and adjusting the sign and function type (sine or cosine) based on the graph's pattern.
Example of how to adjust the equation when moving to different starting points on the graph.
Explanation of how to handle graphs with unusual periods by counting multiple periods and dividing.
Calculation of the increment per period to assist in finding starting points for different patterns on the graph.
Demonstration of constructing multiple equations for different starting points and verifying the correctness by completing the pattern.
Final review of the process and an encouragement for viewers to apply these methods to find equations for sine and cosine graphs.
Transcripts


5.0 / 5 (0 votes)
Thanks for rating: