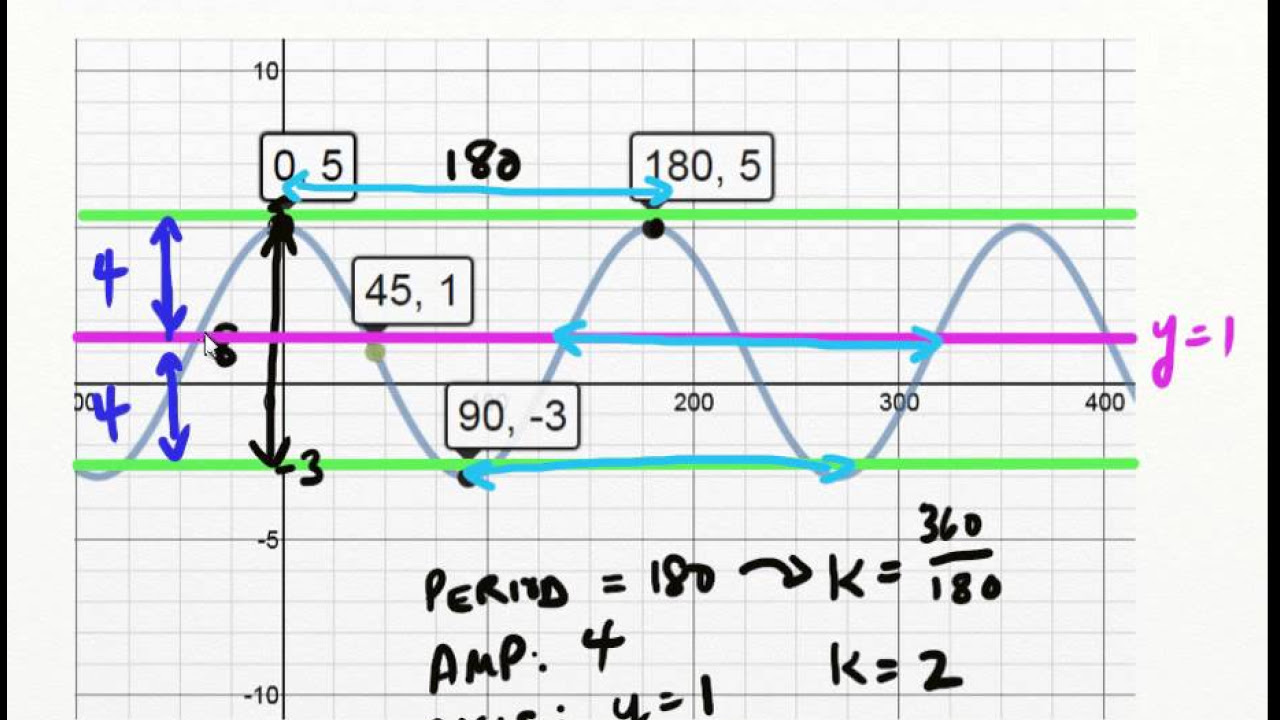
How to Graph the Cosine Graph with Multiple Transformations
TLDRThe video script is an instructional guide on graphing the function f(x) = 3cos(x + 2π/3) - 2. It explains the process of identifying key features such as amplitude, period, phase shift, and vertical translations. The amplitude is determined as 3, the period as 2π, and the phase shift calculated to be -2π/3, leading to a downward shift of the graph by 2 units. The script then illustrates how to plot two complete periods of the transformed cosine function, emphasizing the importance of understanding the transformations and the function's behavior.
Takeaways
- 📈 The function to graph is f(x) = 3cos(x + 2π/3) - 2, which is a transformed cosine function.
- 🔄 The general form of a cosine transformation is a*cos(bx - c) + d, where 'a' is the amplitude, 'b' affects the period, 'c' is the phase shift, and 'd' is the vertical translation.
- 📌 To find the amplitude 'a', take the absolute value of the coefficient in front of the cosine function, which in this case is 3.
- 🔄 The period is calculated by dividing 2π by the coefficient 'b'. With 'b' being 1, the period is 2π.
- 📐 The x-scale is the period divided by 4, which for this function is π/2.
- 🚫 To determine the phase shift, set the expression inside the parentheses to zero and solve for 'x'. Here, the phase shift is -2π/3.
- 📉 The vertical translation 'd' is the constant term at the end of the function, which is -2, indicating a downward shift.
- 📊 Start graphing by identifying key points such as the maximum and minimum values based on the amplitude and period.
- 🔢 Work through the x-axis by adding the x-scale (π/2) to find subsequent points on the graph.
- 📈 The graph begins at -2π/3 on the x-axis and follows the pattern of the cosine function, shifted accordingly.
- 🎥 The final graph will show two complete periods, reflecting the changes in amplitude, phase shift, and vertical transformation.
Q & A
What is the function being graphed in the transcript?
-The function being graphed is f(x) = 3cos(x + 2π/3) - 2.
What does the 'a' value represent in the function's transformation?
-The 'a' value represents the amplitude of the function, which is the distance from the maximum to the minimum value of the graph.
How is the amplitude determined from the given function?
-The amplitude is determined by taking the absolute value of 'a', which in this case is the absolute value of 3, giving us an amplitude of 3.
What is the period of the function?
-The period of the function is calculated by dividing 2π by the value of 'b', which is 1 in this case. So, the period is 2π/1, which simplifies to 2π.
How is the phase shift determined for the given function?
-The phase shift is determined by setting the value inside the parentheses (x + 2π/3) equal to zero and solving for 'x'. This results in a phase shift of -2π/3.
What is the vertical translation of the graph?
-The vertical translation is represented by 'd' in the function. In this case, 'd' is -2, which means the graph is shifted down by 2 units.
How does the amplitude affect the graph of the function?
-The amplitude of 3 affects the graph by determining the maximum and minimum values the function reaches, which are 3 units above and 3 units below the x-axis, respectively.
What is the x scale of the graph?
-The x scale is determined by dividing the period by 4. Since the period is 2π, the x scale is 2π/4, which simplifies to π/2.
How does the phase shift of -2π/3 affect the starting point of the graph?
-The phase shift of -2π/3 affects the starting point by moving it to the left by 2π/3 units on the x-axis, which is the negative direction on the horizontal scale.
What is the process for graphing the function with the given transformations?
-The process involves starting at the phase shift (-2π/3), then moving one x scale to the right and left (π/2 units), and plotting the maximum and minimum values based on the amplitude (3 units up and down from the x-axis), while also accounting for the vertical shift (down by 2 units).
How many periods are graphed in the example provided in the transcript?
-Two complete periods of the function are graphed in the example provided in the transcript.
Outlines
📊 Understanding Trigonometric Graphs - Amplitude, Period, and Phase Shift
This paragraph introduces the process of graphing a trigonometric function, specifically f(x) = 3cos(x + 2π/3) - 2. The speaker explains the importance of understanding the impact of different numbers on the graph and identifies the need to determine the amplitude, period, x scale, phase shift, and vertical translations. The amplitude is found by taking the absolute value of 'a', the period is calculated as 2π divided by 'b', and the phase shift is determined by setting the expression inside the parentheses equal to zero. The vertical translation is identified as 'd'. The speaker then calculates these values for the given function, resulting in an amplitude of 3, a period of π, a phase shift of -2π/3, and a vertical shift down by 2 units.
📈 Plotting the Trigonometric Function - Identifying X Scale and Graphing
The speaker continues by discussing the practical steps of plotting the trigonometric function. They emphasize the importance of identifying the x scale and start by plotting a complete period to the left and right of the starting point. The amplitude's effect on the graph is explained, with the speaker noting that it represents the distance from the maximum to the minimum or the crossing of the x-axis. The speaker then calculates the x scale points, starting at -2π/3 and adding π/2 increments to find subsequent points. The graph is described as shifting down by two units, and the speaker outlines the process of plotting the maximum and minimum points to complete the graph, resulting in a clear visual representation of two periods with the given transformations.
Mindmap
Keywords
💡Graphing
💡Amplitude
💡Period
💡Phase Shift
💡Vertical Translation
💡Transformations
💡Cosine Function
💡X Scale
💡Trigonometric Function
💡Coordinate Plane
💡Equation
Highlights
The speaker introduces a method for graphing the function f(x) = 3cos(x + 2π/3) - 2.
The process begins by identifying the components of the function to understand the transformations.
The amplitude of the function is found by taking the absolute value of 'a', which is 3 in this case.
The period is calculated by dividing 2π by 'b', resulting in a period of 2π.
The x-scale is determined by dividing the period by 4, leading to π/2.
The phase shift is calculated by setting the inside of the parentheses equal to zero, resulting in x = -2π/3.
The vertical translation is found to be -2, indicating a downward shift of the graph.
The speaker explains the impact of amplitude on the graph, which is the distance from the maximum to the minimum.
The x-scale is established by starting at -2π/3 and adding π/2 to find subsequent points.
A pattern is identified for the x-scale, adding 5π/6 for each subsequent point.
The graph is shifted down by 2 units, represented by a dashed x-axis.
The highest point of the cosine graph is determined by the amplitude of 3.
The graph's intercept, minimum, and maximum points are plotted to form one complete period.
The process is repeated to graph two complete periods with the given transformations.
The speaker emphasizes the importance of understanding the x-scale and the pattern of the cosine function.
The final graph demonstrates the combined effects of amplitude, phase shift, and vertical transformation.
Transcripts
Browse More Related Video
MCR3U UNIT 5 Writing Sine Cosine Equation Given Graph
Precalc 5.5 Day 2 Notes
Writing Sine and Cosine Equations from Graphs
Writing Equations for Sinusoidal Functions
Graphing Sine and Cosine Trig Functions With Transformations, Phase Shifts, Period - Domain & Range

How to Graph with Transformations (Precalculus - College Algebra 15)
5.0 / 5 (0 votes)
Thanks for rating: