Trigonometry - Graphing transformations of sin and cos
TLDRThis video tutorial delves into the transformations of sine and cosine functions, teaching viewers how to alter and interpret the basic graphs of these trigonometric functions. The instructor explains the impact of different coefficients on amplitude, period, phase shift, and vertical shift, using the general form y = A sin(B(x - C)) + D. Through step-by-step examples, the video demonstrates how to graph transformed functions, emphasizing the importance of understanding the original sine and cosine shapes and how modifications to the equation affect the graph. The goal is to equip viewers with the skills to analyze and graph sine and cosine functions with various transformations, making complex concepts accessible and practical.
Takeaways
- 📚 The video is a tutorial on transformations of sine and cosine functions, teaching viewers how to alter the basic graph of these trigonometric functions.
- 🔍 The script explains how changes in the equation of a sine or cosine function affect the graph, emphasizing the importance of recognizing key values in the equation for understanding these transformations.
- 📐 The 'a' value in front of the trigonometric function indicates the amplitude and whether the graph is flipped over the x-axis (if 'a' is negative).
- ⏱️ The 'b' value inside the function next to 'x' determines the period of the function, which is found by dividing 2π by the absolute value of 'b'.
- 🔄 The 'c' value inside the function represents the phase shift, calculated by dividing 'c' by 'b', indicating how far left or right the graph has been shifted.
- 📏 The 'd' value represents the vertical shift, indicating how far up or down the graph has been moved.
- 📈 The tutorial provides step-by-step examples to demonstrate how to apply these concepts to graph transformed sine and cosine functions.
- 📉 The amplitude of the sine function in the example 'y = sine of 5x' remains the same (1), but the period is altered to 2π/5 due to the value of 'b'.
- 🔀 The cosine function in the example 'y = -cosine(x) + 2' has an amplitude of 1, a period of 2π, and is flipped over the x-axis due to the negative 'a', and shifted up by 2 units due to 'd'.
- 🤔 The script encourages viewers to keep the basic shape of sine and cosine in mind when considering transformations, to understand what changes have been made to the original graph.
- 📝 The tutorial concludes by reminding viewers to consider all transformations when graphing sine or cosine functions and to extract the necessary information from the equation to apply these transformations.
Q & A
What is the main topic of the video?
-The main topic of the video is the transformations of sine and cosine functions.
What is the purpose of the 'a' value in a sine or cosine function?
-The 'a' value in front of a sine or cosine function gives information about the amplitude and whether the graph should be flipped over the x-axis.
How do you determine the amplitude of a sine or cosine function?
-The amplitude is determined by the absolute value of 'a', the number in front of the trigonometric function.
What does the 'b' value inside the sine or cosine function represent?
-The 'b' value inside the sine or cosine function represents the period of the function, and it is used to find the period by dividing 2π by the absolute value of 'b'.
How do you calculate the phase shift of a sine or cosine function?
-The phase shift is calculated by taking the value of 'c' and dividing it by 'b', considering the negative sign.
What does the 'd' value represent in the context of sine or cosine function transformations?
-The 'd' value represents the vertical shift of the graph, indicating how far up or down the graph has been moved.
What is the basic shape of the sine function and how does it typically look?
-The basic shape of the sine function is an 's' shaped curve, which oscillates between -1 and 1.
What is the basic shape of the cosine function and how does it typically look?
-The basic shape of the cosine function is often thought of as a 'u' shape, similar to the sine function but shifted.
How does the video script guide through graphing the function y = sine(5x)?
-The script guides through identifying the amplitude (a=1), calculating the period (2π/5), and noting there is no phase shift or vertical shift, then drawing the graph accordingly.
Can you provide an example of a more complex transformation discussed in the video?
-An example of a more complex transformation discussed in the video is y = 3 cosine(4x - π/2), which includes an amplitude of 3, a period of π/2, a phase shift of π/8, and no vertical shift.
What is the significance of understanding the different transformations of sine and cosine functions?
-Understanding the different transformations allows one to manipulate and interpret the graphs of sine and cosine functions, which is crucial in various fields such as mathematics, physics, and engineering.
Outlines
📚 Introduction to Trigonometric Transformations
This paragraph introduces the concept of transformations of sine and cosine functions. The instructor explains that starting with a basic sine or cosine graph, various changes can be made to the function's equation, which in turn alter the graph. The focus is on understanding the key values within the equation that indicate changes in amplitude, period, phase shift, and vertical shift. The amplitude is determined by the absolute value of the coefficient 'a' in front of the trigonometric function, and whether the graph is flipped over the x-axis depends on the sign of 'a'. The period is adjusted by the coefficient 'b' next to the variable x, with the new period calculated as 2π divided by the absolute value of 'b'. The phase shift, indicated by 'c', is found by dividing 'c' by 'b', and it tells us how far the graph has been shifted left or right. Lastly, 'd' represents the vertical shift, showing how much the graph has moved up or down. The paragraph sets the stage for examples that will demonstrate these concepts in action.
📈 Graphing y = sin(5x) with No Phase or Vertical Shifts
The second paragraph delves into the practical application of the concepts introduced earlier, starting with the function y = sin(5x). The instructor begins by recalling the basic sine wave with an amplitude of 1 and a period of 2π. For the given function, 'a' is 1, indicating no change in amplitude, and 'b' is 5, which affects the period. The new period is calculated as 2π/5, meaning the function completes a full cycle in 2π/5 instead of the usual 2π. Since there are no values for 'c' and 'd', there is no phase shift or vertical shift, and the graph remains in its standard position. The instructor then sketches one complete cycle of the sine wave, emphasizing the importance of understanding the basic shape and how the given function alters it. Key values such as the halfway points are also discussed to provide a more detailed understanding of the graph's behavior.
📉 Graphing y = -cos(x) + 2 with Phase and Amplitude Changes
In this paragraph, the instructor presents a more complex example, y = -cos(x) + 2, which involves both amplitude and vertical shift transformations. The amplitude is determined by the absolute value of 'a', which is 1, but the negative sign indicates that the graph is flipped over the x-axis. The period remains unchanged at 2π because 'b' is 1. There is no phase shift since 'c' is not present, but there is a vertical shift indicated by 'd', which is 2, moving the graph up. The instructor then constructs the graph, starting with the vertical shift, followed by marking the amplitude peaks at 3 and -1 (accounting for the negative amplitude). The function's graph is flipped to create an upside-down U shape, and key values are identified at π/2, 3π/2, and other points within the cycle to complete the graph.
🔍 Advanced Graphing with Phase Shifts: y = 4sin(x + 3π/2)
The third example tackled in the script is y = 4sin(x + 3π/2), which includes an amplitude change and a phase shift. The amplitude is 4, significantly larger than the basic sine wave. There is no 'b' value affecting the period, so it remains at 2π. The phase shift is determined by 'c', which is 3π/2, and when divided by the 'b' value (which is 1), it indicates a phase shift of -3π/2. This means the graph starts not at 0 but at -3π/2. The instructor calculates where the graph should stop after one complete period, which is at π/2, and then breaks down the cycle into quarters to find key values such as -2π/2, -π/2, 0, and π/2. The graph is drawn accordingly, starting from the phase shift point and completing one period, with the sine wave's peak and trough marked according to the new amplitude of 4.
📊 Graphing y = 3cos(4x - π/2) with Amplitude and Phase Shift
The final paragraph in the script discusses the function y = 3cos(4x - π/2), which includes an amplitude of 3 and a phase shift. The instructor begins by noting the amplitude and the 'b' value of 4, which affects the period. The new period is π/2, as calculated by 2π divided by the absolute value of 4. The phase shift is determined by 'c', which is π/2, and when divided by 'b', it results in a phase shift of π/8. There is no vertical shift, as indicated by the absence of a 'd' value. The instructor then graphs the function, marking the amplitude peaks at 3 and -3, and starting the graph at the phase shift point, π/8. The complete cycle is drawn within π/2, and key values are identified at 3π/8, 2π/8, and other points within the cycle. The instructor emphasizes the continuous nature of the graph beyond the drawn period.
Mindmap
Keywords
💡Transformations
💡Amplitude
💡Period
💡Phase Shift
💡Vertical Shift
💡Sine Function
💡Cosine Function
💡Graphing
💡Coefficients
💡Trigonometric Functions
Highlights
Introduction to transformations of sine and cosine functions.
Explanation of how changes in the equation affect the graph of sine or cosine.
Key values in the equation provide information on transformations.
The 'a' value in front of the trigonometric function indicates amplitude and potential flip.
Amplitude is the absolute value of 'a'.
The 'b' value inside the function determines the period.
To find the period, divide 2π by the absolute value of 'b'.
The 'c' value represents the phase shift.
Phase shift is calculated by dividing 'c' by 'b'.
Understanding the direction of phase shift based on the sign of 'c'.
The 'd' value represents the vertical shift.
Graphing y = sine(5x) as an example.
Step-by-step process of graphing a transformed sine function.
Graphing y = -cosine(x) + 2 with amplitude, period, phase shift, and vertical shift.
Explanation of how to flip a graph over the x-axis.
Graphing y = 4sine(x + 3π/2) with amplitude and phase shift.
Using key values to determine the starting and ending points of the graph.
Graphing y = 3cosine(4x - π/2) with amplitude, period, phase shift, and no vertical shift.
Calculating phase shift and determining the graph's starting point.
Final graph and understanding of the continuous nature of sine and cosine transformations.
Transcripts
Browse More Related Video

Graphing Transformations with Sine and Cosine (Precalculus - Trigonometry 12)
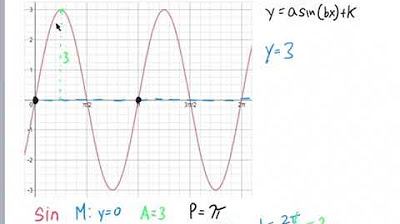
Precalc 5.5 Day 2 Notes

GRAPHS OF SINE AND COSINE FUNCTIONS || PRE-CALCULUS
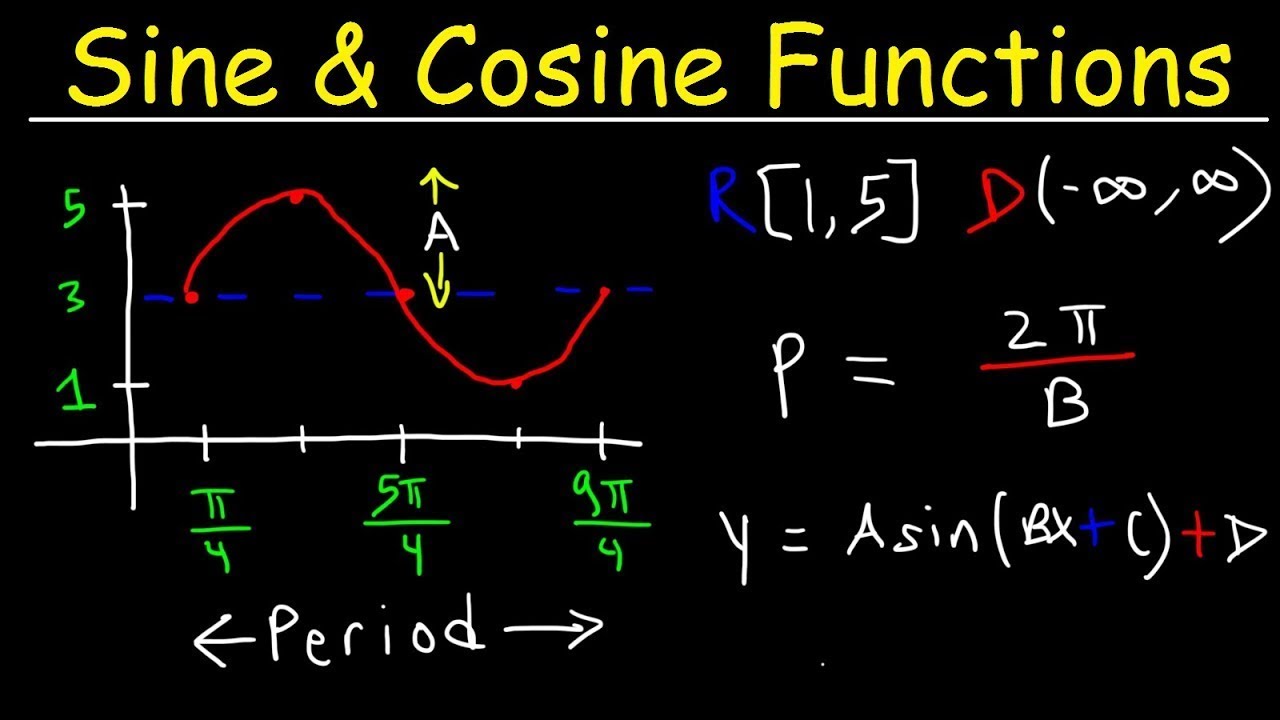
How To Graph Trigonometric Functions | Trigonometry
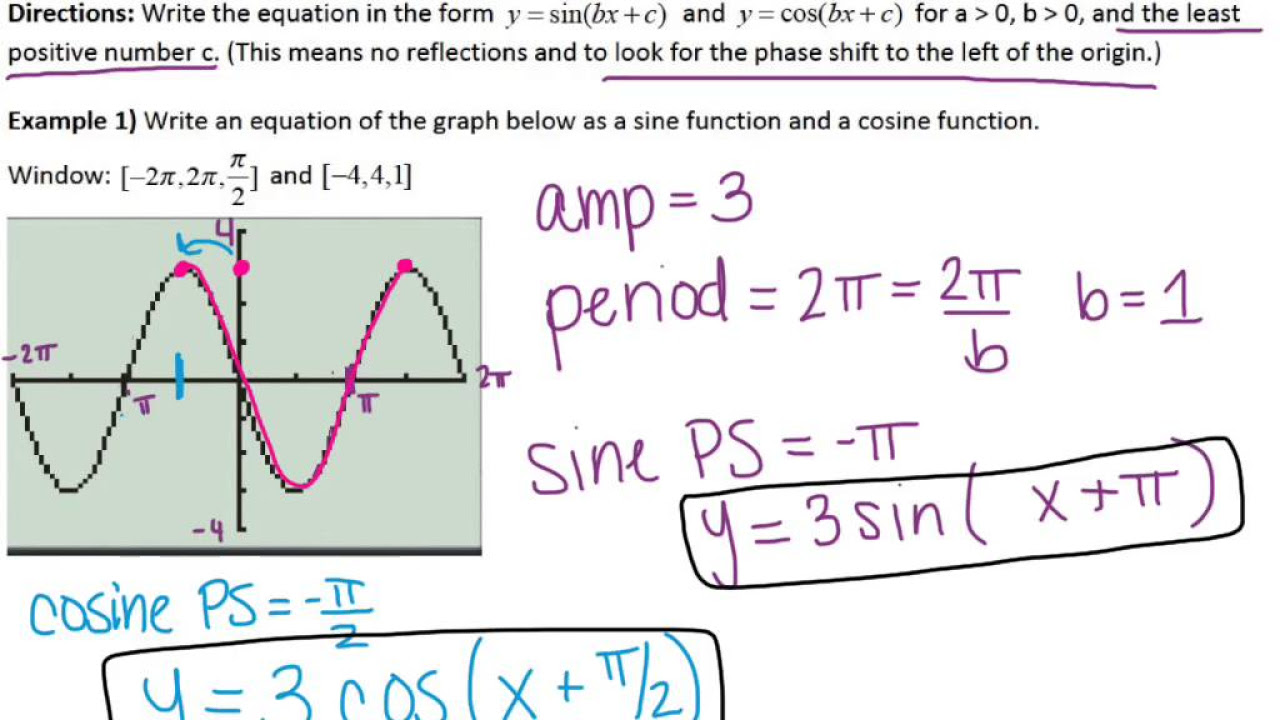
Writing Equations for Sinusoidal Functions
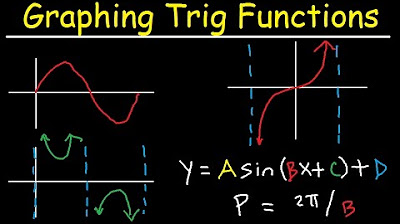
Graphing Trigonometric Functions, Phase Shift, Period, Transformations, Tangent, Cosecant, Cosine
5.0 / 5 (0 votes)
Thanks for rating: