TI84 Graph a line and find table of values
TLDRThis podcast tutorial demonstrates how to input an equation into a graphing calculator and utilize the table of values to accurately plot it on a graph. The host begins by showing how to enter the equation y = 3x + 3 and adjust the calculator's window settings for a standard view. They then explain how to set the window to match a specific graph's range and scale. The process of accessing the table of values to plot points and draw lines is detailed, ensuring the graph is precise. The tutorial also covers plotting multiple equations on the same graph and adjusting the window settings to accommodate different scales, providing a comprehensive guide to graphing equations using a calculator.
Takeaways
- 📚 The podcast is a tutorial on how to input an equation into a graphing calculator and use it to plot a graph.
- 🔍 The presenter starts by explaining how to input the equation 'y = 3x + 3' into the calculator using the 'Y=' button.
- 📏 To view the equation, the presenter uses 'Zoom 6' for a standard view and 'Zoom 5' to adjust the x and y scales for proportionality.
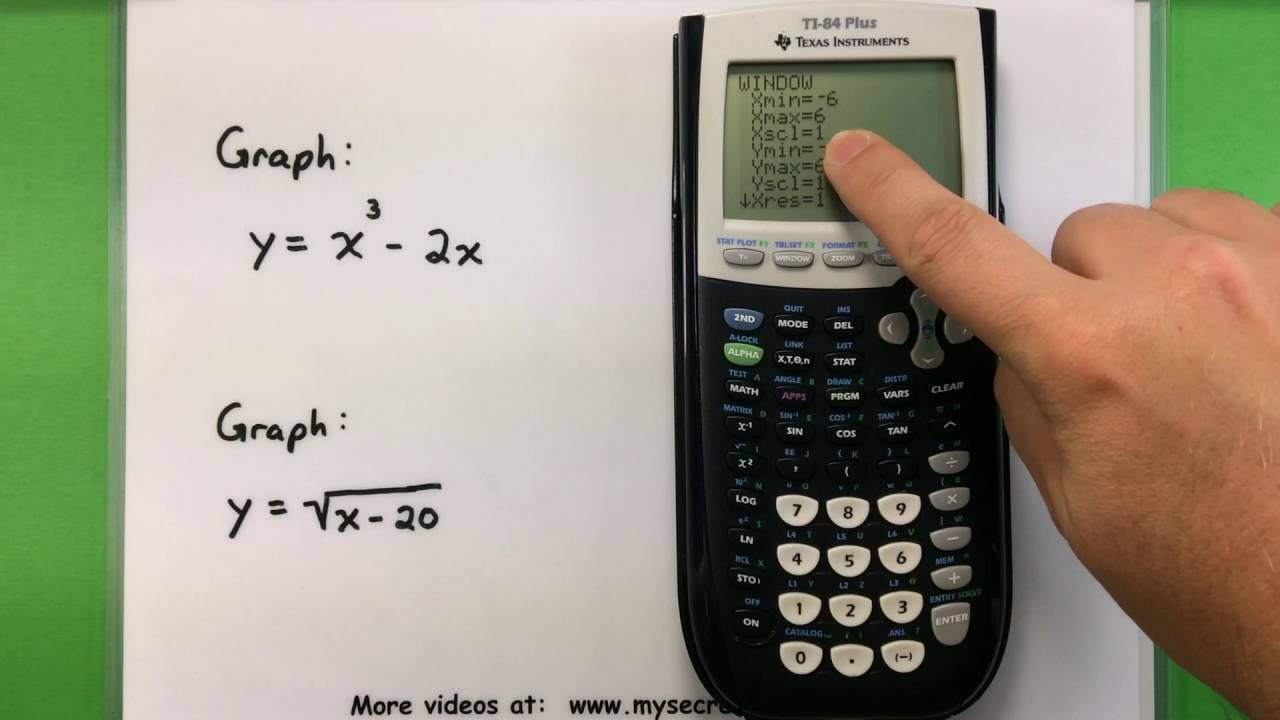
- 🖼️ The script discusses the importance of setting the graph window to match the desired range, such as -4 to 4 for both x and y axes.
- 🛠️ The presenter demonstrates how to reset the window settings to fit the graph within the specified range.
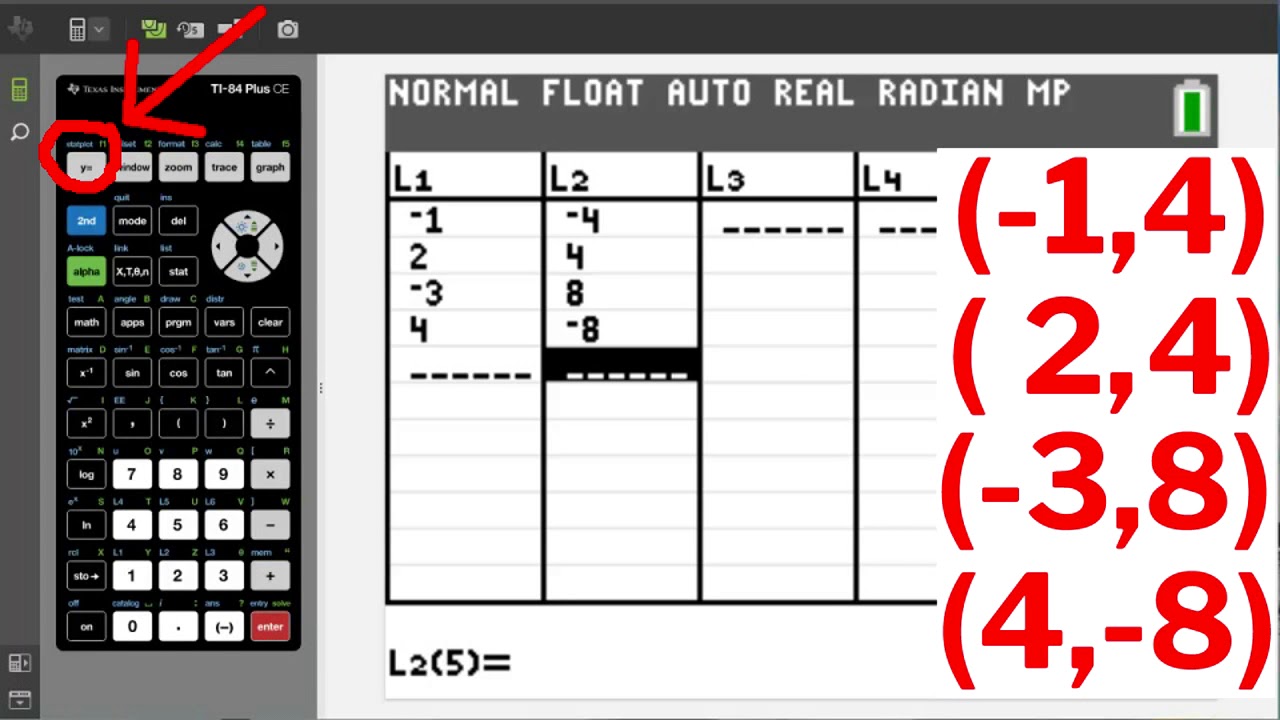
- 📈 To plot the equation accurately, the presenter suggests using the table of values feature to find points that fit on the graph.
- 📊 The table of values is accessed by pressing '2nd' followed by 'Graph', allowing the user to scroll through and select appropriate points.
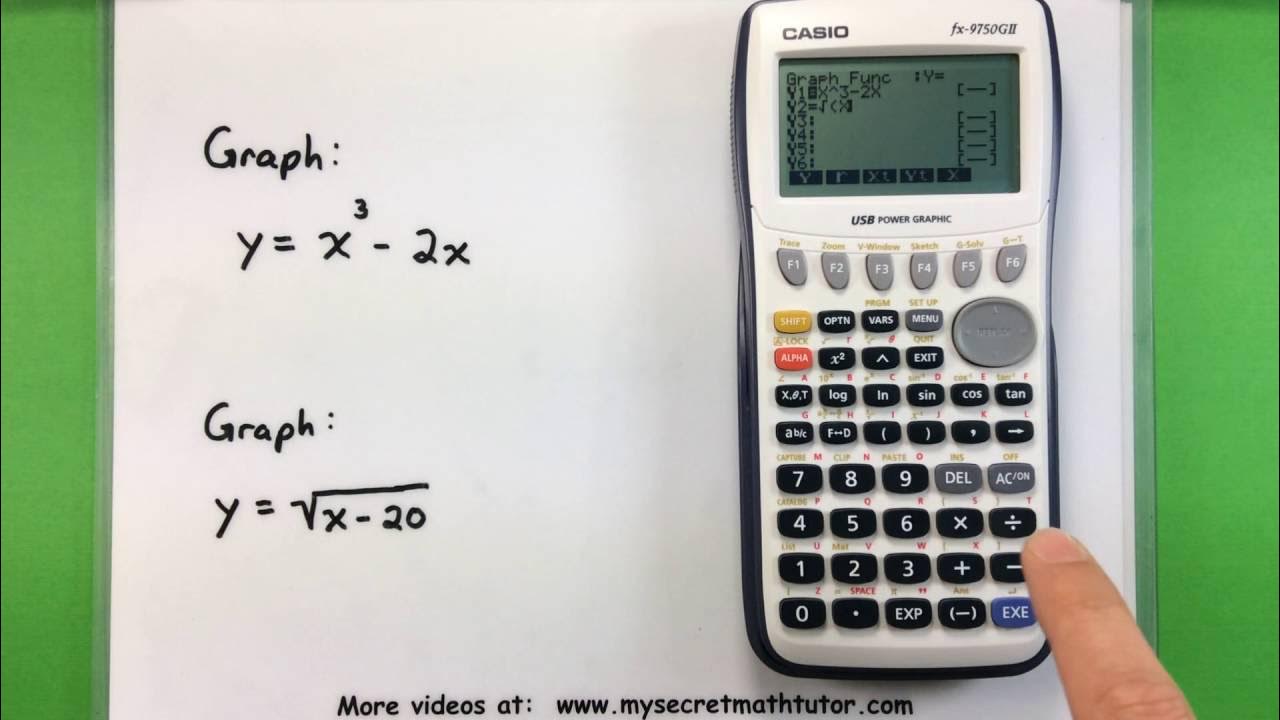
- 🔄 The presenter also covers how to plot multiple equations on the same graph, such as 'y1 = 3x + 3' and 'y2 = -2x - 6'.
- 🔢 The process of adjusting the window settings to accommodate both equations and their respective ranges is explained.
- 📝 The importance of using the table of values to ensure all points fit on the graph and to accurately plot the lines is highlighted.
- 🎨 Finally, the presenter shows how to view and utilize the table of values for both equations to complete the graphing process.
Q & A
What is the main purpose of the podcast?
-The main purpose of the podcast is to demonstrate how to input an equation into a graphing calculator, use the table of values, and plot it correctly on a graph.
Which button is used to start inputting an equation on a graphing calculator?
-The 'Y=' button is used to start inputting an equation on a graphing calculator.
What is the first equation demonstrated in the podcast?
-The first equation demonstrated is y = 3x + 3.
How can you ensure that the x's and y's are in proportion on the graph?
-You can ensure that the x's and y's are in proportion by using the 'ZoomSquare' function on the graphing calculator.
What is the significance of resetting the window in the graphing calculator?
-Resetting the window allows you to set the range and scale of the x and y values to match the specific requirements of the graph you are plotting.
What is the purpose of the table of values in graphing equations?
-The table of values is used to find specific points that correspond to the equation, which can then be plotted on the graph for accurate representation.
How do you access the table of values on a graphing calculator?
-To access the table of values, you press the '2nd' button followed by the 'Graph' button.
What is the second equation added to the graph in the podcast?
-The second equation added to the graph is y2 = -2x - 6.
How can you plot multiple equations on the same graph?
-You can plot multiple equations by defining each equation (e.g., y1, y2) and then pressing the 'Graph' button to display all equations on the same graph.
Why is it necessary to adjust the window settings before plotting?
-Adjusting the window settings ensures that the graph's scale and range are appropriate for the equations being plotted, making the graph accurate and readable.
How does the podcast suggest covering all the values that fit on the graph?
-The podcast suggests using the up arrow key to navigate through the table of values and select all the points that fit within the graph's window settings.
Outlines
📚 Introduction to Graphing Equations
This paragraph introduces the tutorial's aim to demonstrate how to input an equation into a graphing calculator and use the table of values to plot it accurately. The speaker begins by accessing the 'Y equals' function on the calculator and enters the equation y = 3x + 3. They explain the importance of adjusting the calculator's zoom to ensure a standard view and a square window for accurate representation of the equation's slope. Additionally, they discuss resetting the window settings to fit the graph's x and y ranges and how to plot the equation accurately within those settings.
📈 Plotting Equations and Adjusting Window Settings
In this paragraph, the speaker describes the process of plotting the equation on a graph with specific x and y ranges. They mention the need to reset the window to match the graph's scale and explain how to use the 'graph' key without erasing the window settings. The paragraph also covers the importance of obtaining the table of values to plot points accurately on the graph. The speaker provides an example of plotting the equation y = 3x + 3 within the given x and y ranges and suggests using the table of values to ensure precision.
🔍 Using the Table of Values for Accurate Plotting
The speaker elaborates on how to use the table of values to plot points for the equation y = 3x + 3. They demonstrate accessing the table function and selecting appropriate values that fit within the graph's window. The paragraph details the process of plotting these points and drawing a line through them to represent the equation accurately. It also touches on the possibility of having to plot multiple equations on the same graph, providing a brief overview of how to do so.
📉 Adding a Second Equation to the Graph
This paragraph focuses on adding a second equation, y = -2x - 6, to the graph. The speaker guides through entering this equation as Y2 and then plotting it alongside the first equation. They explain how to adjust the window settings to accommodate both equations and ensure that the graph accurately reflects the x and y scales. The paragraph concludes with the speaker using the table of values for both equations to plot the points and demonstrate how to cover all the necessary values within the graph's range.
Mindmap
Keywords
💡Graphing Calculator
💡Equation
💡Zoom
💡Window Settings
💡Table of Values
💡Plotting
💡Slope
💡Y1 and Y2
💡Reset
💡Graph Key
Highlights
Introduction to the podcast on how to use a graphing calculator to plot equations.
Explanation of the 'Y equals' button for entering equations on a graphing calculator.
Demonstration of inputting the equation y = 3x + 3 into the calculator.
Use of the 'Zoom' feature to adjust the calculator's view for a standard equation view.
Importance of a square window for accurate representation of the equation's slope.
Instructions on resetting the window settings to match a given graph's range.
Guidance on setting the x and y scales to match the graph's requirements.
How to avoid erasing window settings when switching to graph mode.
Process of obtaining a table of values for plotting points on the graph.
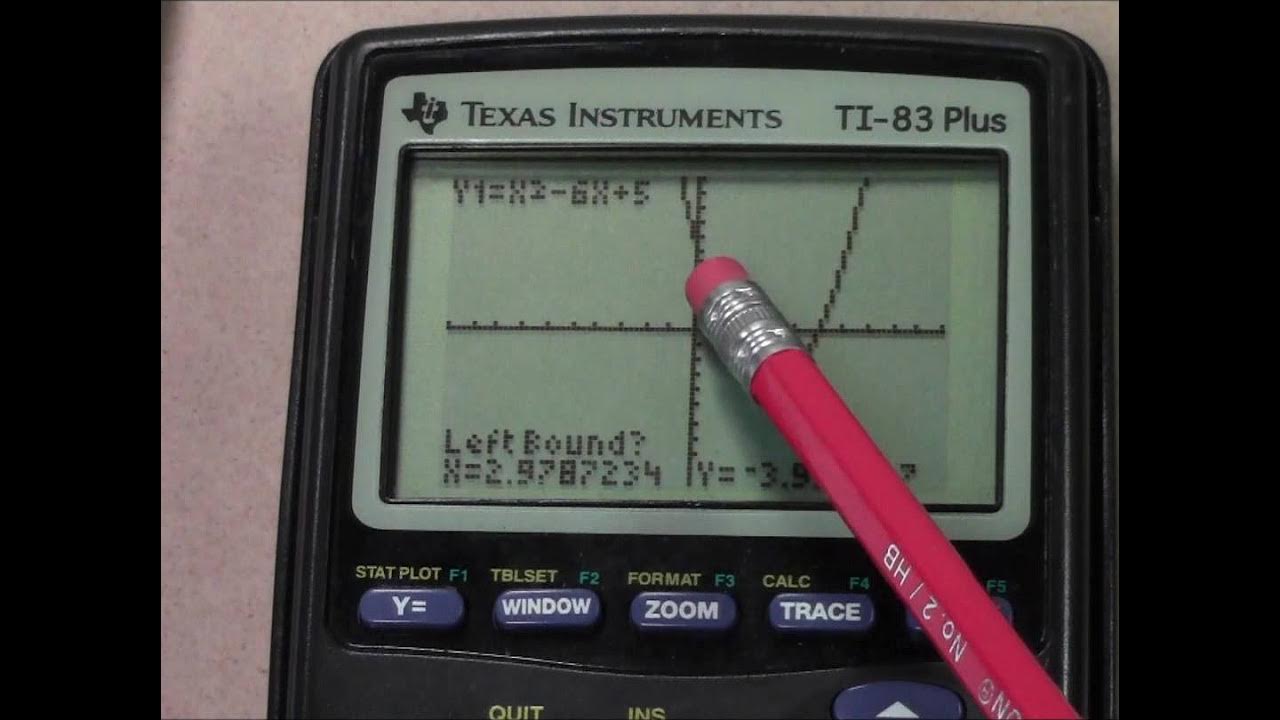
Method to plot points and draw lines accurately on the graph.
Discussion on adding a second equation to the graph.
Entering a second equation, y2 = -2x - 6, on the graphing calculator.
Adjusting the graph window to accommodate multiple equations.
Explanation of the graph window settings for a range from -8 to 8.
Final step of viewing both equations on the graph with the correct table of values.
Highlighting the importance of covering all values that fit on the graph.
Conclusion of the podcast with a summary of the steps taken to plot equations.
Transcripts
Browse More Related Video

5.0 / 5 (0 votes)
Thanks for rating: