TI84 Plus CE Plotting and Graphing Points
TLDRThis tutorial video guides viewers through the process of plotting points on a TI-84 Plus CE graphing calculator. It begins by clearing previous data and entering new X and Y coordinates for the points to be graphed. The video demonstrates how to navigate the calculator's STAT and Y= menus to set up Plot 1, choosing the appropriate graph type and adjusting marker and color settings. It then instructs on clearing any existing equations to avoid interference with the point plot. Finally, the video shows how to use the ZOOM and TRACE functions to view and identify the plotted points, providing a step-by-step approach to mastering this fundamental skill on the TI-84 Plus CE.
Takeaways
- 📚 The video is a tutorial on plotting points using a TI-84 Plus CE graphing calculator.
- 🔍 The presenter, Rob, guides viewers through the process of entering and graphing four specific points.
- 👉 To start, the user must access the 'STAT' button and then 'EDIT' to clear or edit existing points.
- 📌 Rob demonstrates how to clear points from 'L1' and 'L2' lists by highlighting and using the 'Clear' button.
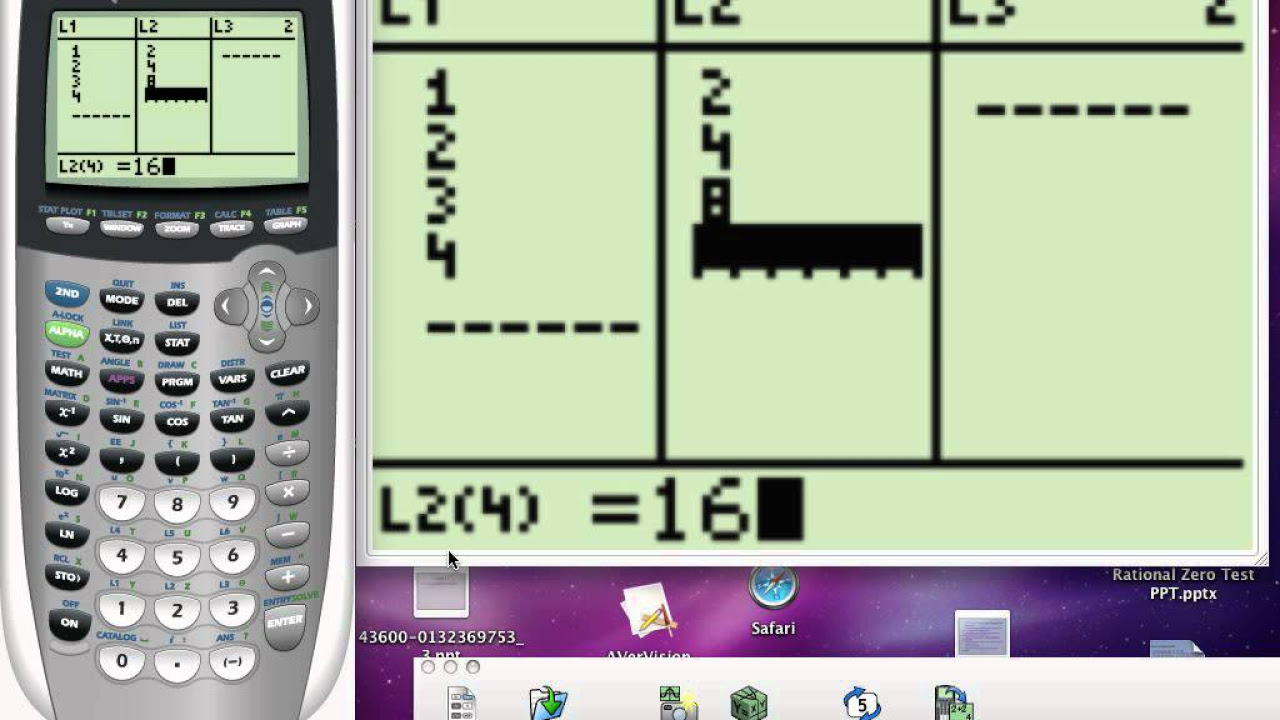
- ✍️ The tutorial explains how to enter new points into 'L1' for the x-coordinates and 'L2' for the y-coordinates.
- ⚠️ A mistake is shown where using a minus sign instead of a negative sign results in an error message.
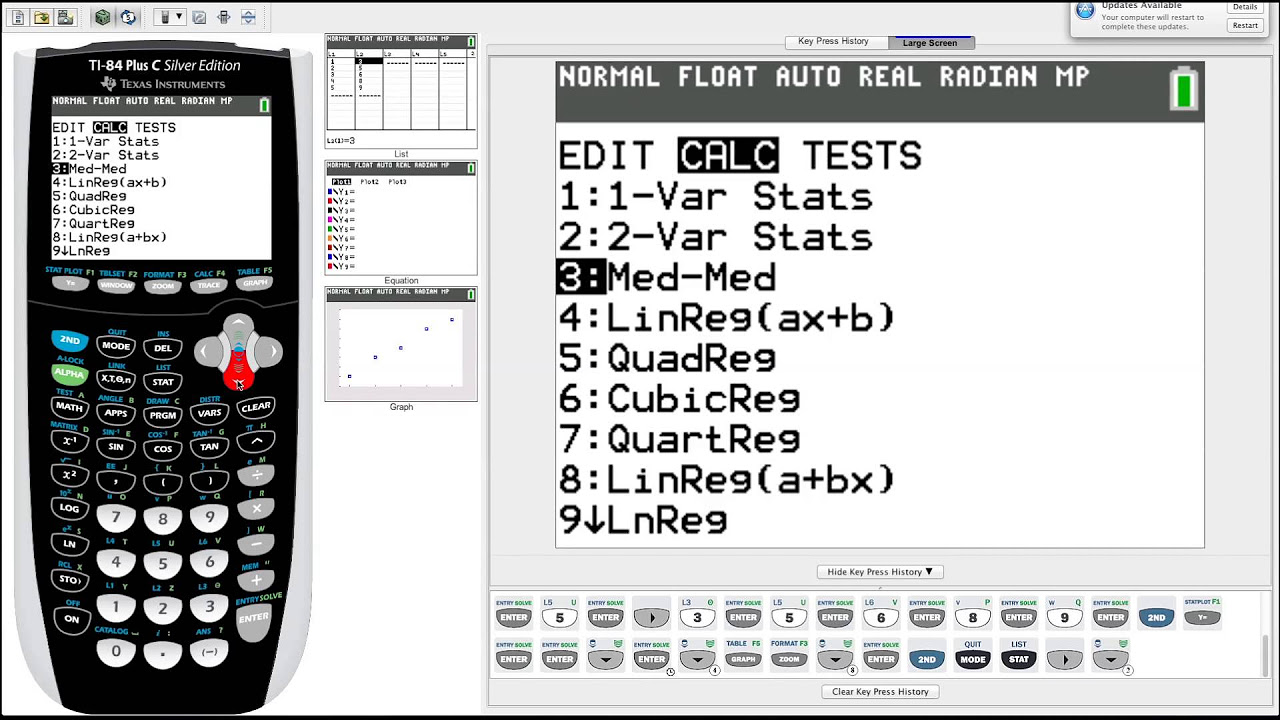
- 🔄 After entering the points, the user is instructed to go to 'STAT PLOT' to set up the graphing of the points.
- 📈 The video details how to turn on 'Plot 1' and choose the type of graph, which in this case is plotting points.
- 🎨 Options for the appearance of the points, such as mark style and color, are also discussed.
- 🧩 Before plotting, the video emphasizes the importance of clearing any previous equations from 'Y=' to avoid confusion.
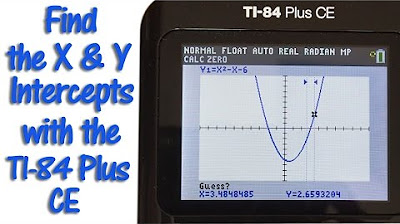
- 🔍 Finally, the 'ZOOM' button is used with 'ZoomStat' to display the plotted points, and the 'TRACE' function helps identify individual points.
Q & A
What is the main topic of the video?
-The main topic of the video is how to plot points on the TI-84 Plus CE graphing calculator.
What is the first step to plot points on the TI-84 Plus CE calculator?
-The first step is to enter the points by going to the STAT button and then to number one edit.
How do you clear previous points from L1 and L2 on the calculator?
-To clear previous points, go to L1, highlight, press the Clear button, and then press ENTER. Repeat the process for L2.
What should you do if you mistakenly use the minus sign instead of the negative sign when entering points?
-If you use the minus sign instead of the negative sign, you will get an error message. Press 1 for quit, go back to STAT, press 1 for edit, and correct the entry.
How do you enter the X points for plotting on the TI-84 Plus CE calculator?
-Under L1, list all the X points by entering the values and pressing ENTER after each one.
What is the process for entering Y values corresponding to the X values on the calculator?
-Move over to L2 and enter the corresponding Y values for the X values you have entered.
How do you turn on Plot 1 on the TI-84 Plus CE calculator?
-Go to STAT PLOT, select Plot 1, and press ENTER to turn it on.
What button combination is used to access the Plot Setup on the TI-84 Plus CE calculator?
-Press the second button and the Y= button to access the Plot Setup.
Why is it important to clear out any equations from previous problems before plotting points?
-It's important to clear out previous equations to avoid having the graph plot those equations along with the points.
How do you use the ZoomStat feature to view the plotted points on the TI-84 Plus CE calculator?
-Go to the ZOOM button, select number 9 for ZoomStat, and press ENTER to view the plotted points.
What is the purpose of the Trace button when viewing plotted points on the calculator?
-The Trace button allows you to identify and view the coordinates of individual points on the graph.
Outlines
📚 Plotting Points on TI-84 Plus CE
This paragraph provides a step-by-step tutorial on how to plot points on the TI-84 Plus CE graphing calculator. It begins with entering the points by navigating to the 'STAT' button and selecting 'Edit' to clear any existing points and prepare for new entries. The user is instructed to input the X and Y coordinates for the points, emphasizing the importance of using the correct negative sign to avoid errors. After entering the points, the tutorial moves on to enabling Plot 1 through the 'STAT PLOT' menu and selecting the appropriate graph type for plotting points. The user is guided to ensure the X values are under L1 and Y values under L2, and to choose the marker style and color for the points. The tutorial concludes with instructions on clearing any previous equations and using the 'ZOOM STAT' command to view the plotted points, with an additional tip on using the trace feature to identify specific points on the graph.
🔍 Identifying Plotted Points on TI-84 Plus CE
This paragraph continues the tutorial by demonstrating how to identify individual plotted points on the TI-84 Plus CE graphing calculator. It explains the use of the trace feature to view the coordinates of each point. The user is shown how to navigate through the points using the arrow keys, with examples provided for each point's coordinates: (-1, -4), (2, 4), (-3, 8), and (4, -8). The paragraph concludes with a call to action, encouraging viewers to like the video and subscribe to the channel for more content.
Mindmap
Keywords
💡TI-84 Plus CE
💡Plotting Points
💡Graphing Calculator
💡Stat Button
💡Edit
💡Data Lists
💡Negative Sign
💡Plot 1
💡Y-Equals
💡Zoom
💡Trace
Highlights
Introduction to plotting points on the TI-84 Plus CE graphing calculator.
Accessing the STAT button to enter points for graphing.
Clearing previous points by editing L1 and L2 lists.
Entering new X points for plotting, including proper use of the negative sign.
Demonstration of an error message when using the minus sign instead of the negative sign.
Entering corresponding Y values for each X point in the L2 list.
Navigating to STAT PLOT to configure plotting settings.
Turning on Plot 1 and selecting the type of graph to plot points.
Ensuring X values are under L1 and Y values under L2 for plotting.
Customizing the appearance of marks and choosing their color.
Clearing previous equations from Y1 and Y2 to avoid unwanted plots.
Using the ZOOM STAT command to view the plotted points.
Utilizing the TRACE button to identify individual points on the graph.
Step-by-step guide to plotting each point and verifying their coordinates.
Encouragement to like and subscribe for more educational content.
Transcripts


5.0 / 5 (0 votes)
Thanks for rating: