Basic Math - Graphing with a Casio fx-9750GII Calculator
TLDRThis tutorial video guides viewers on how to use the Casio FX-9750 GII calculator for basic graphing. It covers entering equations, adjusting window size for optimal graph visualization, and utilizing the TRACE and EVALUATE functions to identify key points on the graph. The instructor demonstrates switching to graphing mode, entering 'x cubed minus 2x', adjusting the viewing window, and graphing multiple equations like 'square root of (x-20)'. They also explain how to adjust the graph for better visibility, selectively graph equations, and use the TRACE function to explore specific points on the graph, such as evaluating at 'x=-1' and 'x=2'. The video concludes with a prompt to visit the website for more educational content.
Takeaways
- 📚 The video provides a tutorial on using the Casio FX-9750 GII calculator for basic graphing.
- 🔍 It covers how to enter equations into the calculator and adjust the window size for optimal graph visualization.
- 📈 The TRACE and EVALUATE features of the calculator are introduced for finding key values or points on the graph.
- 💡 To access graphing mode, the user must navigate through the Casio menu from the run/Matrix mode.
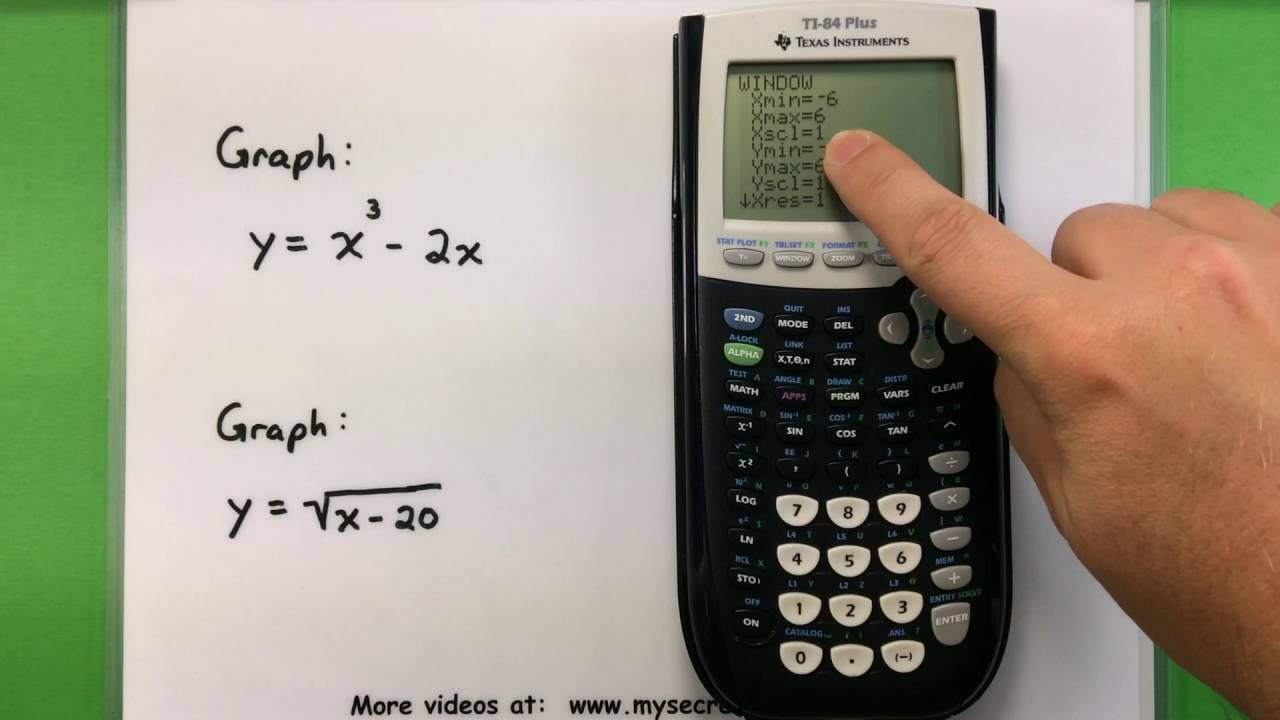
- 🔢 The first equation entered is 'x cubed minus 2x', and only the right side of the equation needs to be inputted.
- 🖼️ The 'V' window or viewing window is used to adjust the graph's window size, with default values typically ranging from -10 to 10 for both x and y axes.
- 🎛️ Customizing the X-Min, X-Max, Y-Min, and Y-Max values can enhance the graph's visibility and clarity.
- 📊 The draw button (F6) is used to visualize the graph after equations and window adjustments are made.
- ✏️ Errors or adjustments in equations can be corrected by navigating back to the function menu using the EXIT button.
- 📉 The video also demonstrates how to graph a second equation and adjust the window to ensure both graphs are visible.
- 🔍 The TRACE function (accessed by pressing SHIFT and F1) allows users to move along the graph and identify specific points.
- 📝 The EVALUATE feature enables the user to find the y-coordinate for a given x-value by typing it in directly.
Q & A
What is the main topic of the video?
-The main topic of the video is to teach basic graphing on a Casio FX-9750 GII calculator, including entering equations, adjusting window size, and using trace and evaluate features.
How do you access the graphing mode on a Casio FX-9750 GII calculator?
-To access the graphing mode, you need to go into the Casio menu, then arrow over to the graphing mode and press execute.
What is the first equation that the tutor enters in the video?
-The first equation entered in the video is 'x cubed minus 2x'.
What does the 'V' window in the calculator represent?
-The 'V' window, or viewing window, is used to adjust the window size to get a better picture of the graph.
What are the default X-Min and X-Max values on the calculator's graphing window?
-The default X-Min and X-Max values are usually set between negative 10 and 10.
How does the tutor adjust the X-Min and X-Max values for the graph of 'x cubed minus 2x'?
-The tutor sets the X-Min to -6 and the X-Max to +6 for the graph of 'x cubed minus 2x'.
What button combination is used to access the draw function and view the graph?
-The draw function is accessed by pressing F6.
What is the second equation that the tutor decides to graph?
-The second equation is the square root of (x-20).
How can you adjust the visibility of multiple graphs on the calculator?
-You can adjust the visibility by using the 'SEL' (select) function to choose which equations to highlight and therefore which to draw.
What is the purpose of the TRACE feature on the calculator?
-The TRACE feature allows you to move along the graph and evaluate the coordinates at specific points.
How do you use the EVALUATE feature to find the y-coordinate for a specific x-value?
-You type in the specific x-value, press EXECUTE, and the calculator will show the corresponding y-coordinate on the graph.
What website does the tutor recommend for more videos?
-The tutor recommends visiting mysecretmathtutor.com for more videos.
Outlines
📚 Introduction to Graphing on Casio FX-9750 GII Calculator
This paragraph introduces the video's purpose, which is to demonstrate basic graphing techniques on the Casio FX-9750 GII calculator. The focus is on entering equations, adjusting window size for optimal graph visualization, and utilizing the TRACE and EVALUATE features to identify key points on the graph. The speaker guides viewers through turning on the calculator, accessing the graphing mode from the main menu, and entering the first equation 'x cubed minus 2x'. The process of adjusting the viewing window ('V' window) to better visualize the graph by setting appropriate X-Min, X-Max, Y-Min, and Y-Max values is explained. The speaker also mentions the scale feature and how to exit the window settings. The paragraph concludes with instructions on how to view the graph by using the draw button and the initial appearance of the graph for the entered equation.
📈 Adjusting Graph Window and Using TRACE and EVALUATE Features
The second paragraph continues the tutorial by discussing how to adjust the graph window to include all relevant parts of the graph, using the example of adding a second equation 'square root of (x-20)' under 'y2'. The speaker explains how to access and modify the 'V' window settings to ensure both graphs are visible, specifically by increasing the X-Max value to 30. After adjusting the window, the speaker demonstrates how to graph both equations simultaneously and how to selectively graph only one equation by either deleting it or using the 'SEL' function to deselect it from being drawn. The paragraph then moves on to the TRACE and EVALUATE features, showing how to trace the graph using the SHIFT and F1 keys and how to evaluate the graph at specific x-values by typing them in. The speaker illustrates this with examples, such as evaluating the graph at x=-1 and x=2, and concludes by reminding viewers how to return to the menu for regular calculations and inviting them to visit the website for more video tutorials.
Mindmap
Keywords
💡Casio FX-9750 GII calculator
💡Entering Equations
💡Window Size
💡TRACE and EVALUATE features
💡Graphing Mode
💡Variable Button
💡DRAW Button
💡Function Menu
💡Scale Feature
💡X-Min and X-Max
💡Y-Min and Y-Max
Highlights
Introduction to using the Casio FX-9750 GII calculator for basic graphing.
How to enter equations into the calculator.
Adjusting window size for optimal graph visualization.
Utilizing TRACE and EVALUATE features for finding key values on the graph.
Switching to graphing mode from the run/Matrix mode.
Entering the equation 'x cubed minus 2x' into the calculator.
Accessing the viewing window ('V' window) for adjustments.
Setting X-Min and X-Max to -6 and +6 for better graph representation.
Adjusting Y-Min and Y-Max to visualize the graph effectively.
Explanation of the scale feature in the viewing window.
Using the draw button to visualize the graph of the entered equation.
Adjusting or correcting equations using the function menu.
Graphing a second equation 'square root of (x-20)' under 'y2'.
Adjusting the X-Max to 30 to view both graphs on the screen.
Turning off one graph to focus on the other using the select feature.
Using TRACE to move along the graph and find specific points.
Evaluating the graph at specific x-values for y-coordinates.
Resetting the viewing window to default settings for different graph analysis.
How to return to regular calculations from the graphing mode.
Invitation to visit mysecretmathtutor.com for more video tutorials.
Transcripts
Browse More Related Video
Basic Math - Graphing with a Ti-83 or Ti-84 Calculator

Statistics - Making a scatter plot using the Ti-89 calculator

TI84 Graph a line and find table of values
TI84 Plus CE Plotting and Graphing Points
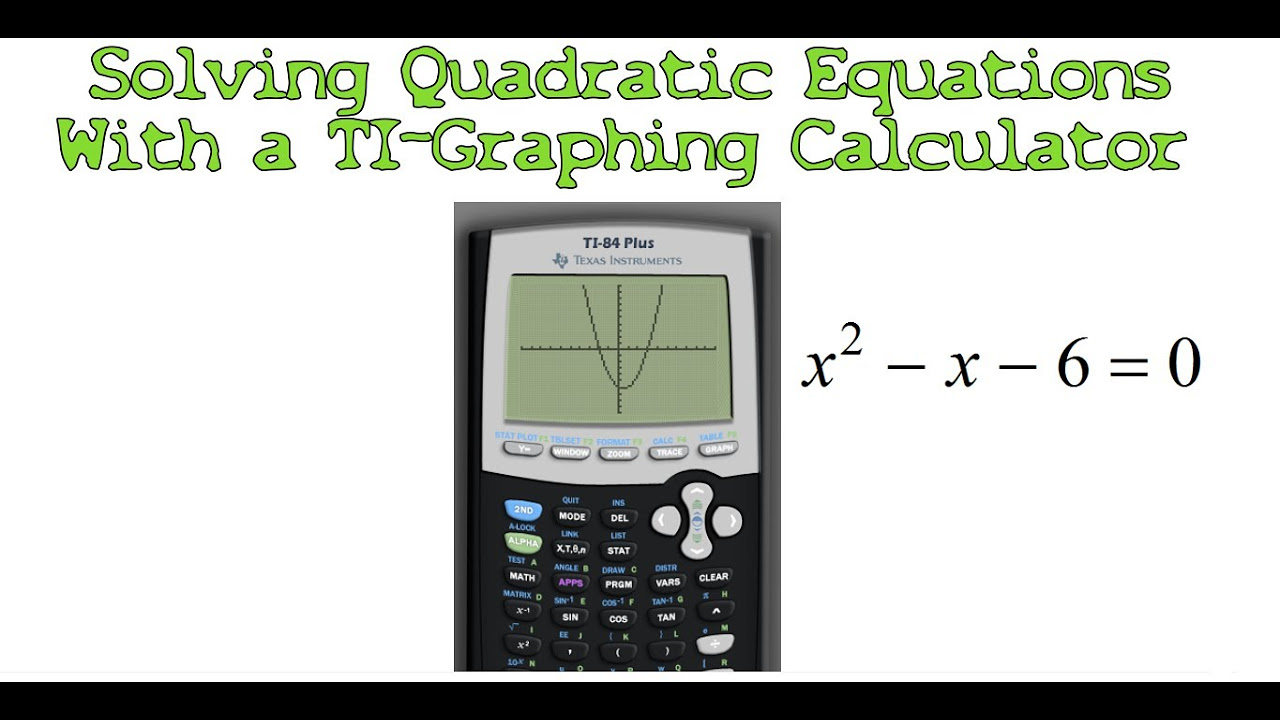
Solving Quadratic Equations with a TI-Graphing Calculator
TI-84 Plus Graphing Calculator Guide: Graphing functions
5.0 / 5 (0 votes)
Thanks for rating: