Judging outliers in a dataset | Summarizing quantitative data | AP Statistics | Khan Academy
TLDRThe video script discusses the concept of outliers in a dataset and how to identify them. It begins with a list of 15 numbers ranging from 1 to 19 and visually represents the distribution on a number line. The instructor then explains the statistical approach to defining outliers as values that lie more than one and a half times the interquartile range (IQR) from the first (Q1) or third (Q3) quartile. The median, Q1, and Q3 are calculated for the given numbers, and the IQR is determined. Using the IQR, the script calculates the thresholds for identifying outliers, which in this case are numbers less than 5.5 or greater than 25.5. The video concludes with a demonstration of how to draw box-and-whiskers plots, both including and excluding outliers, to visually represent the dataset's distribution and highlight any outliers present.
Takeaways
- 📊 **Understanding Outliers**: The video discusses how to identify outliers in a set of 15 numbers by visualizing their distribution on a number line.
- 📈 **Median and Quartiles**: The median (Q2) is the middle number in a data set, while Q1 and Q3 are the middle numbers of the lower and upper halves respectively.
- 🔢 **Identifying Q1 and Q3**: Q1 is the fourth number in the lower half of the data set, and Q3 is the fourth number in the upper half.
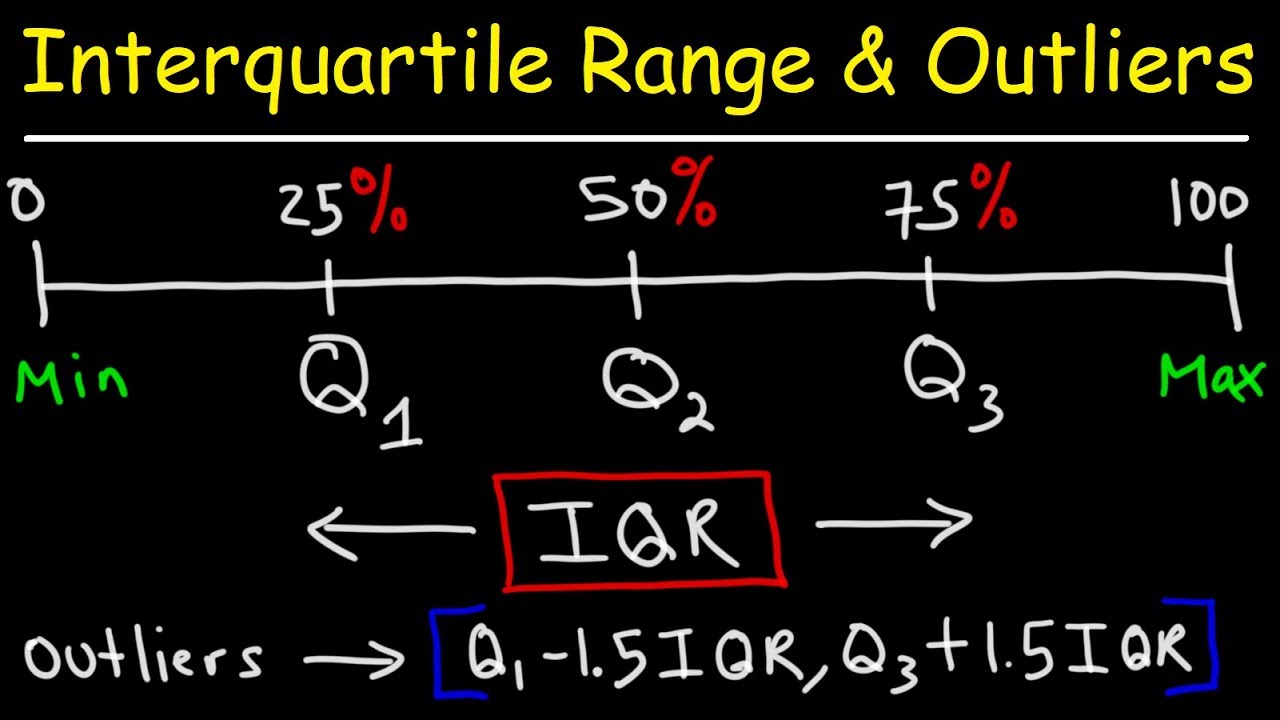
- 🚶♂️ **Interquartile Range (IQR)**: The IQR is the difference between Q3 and Q1, which helps in determining the range of the middle 50% of the data.
- 📉 **Outlier Definition**: Outliers are defined as observations more than 1.5 times the IQR below Q1 or above Q3.
- ✅ **Statistical Agreement**: The 1.5 IQR rule is a common statistical agreement to identify outliers, though it can be subjective and vary.
- 🤔 **Subjectivity in Outliers**: There can be reasonable debate about whether certain numbers are outliers based on their proximity to the IQR boundaries.
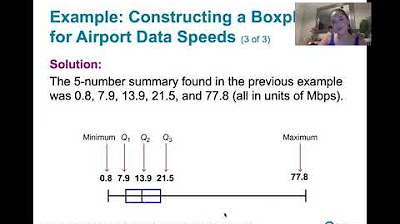
- 📐 **Box-and-Whiskers Plot**: A graphical representation that displays the median, Q1, Q3, and potential outliers, providing a clear visual summary of the data.
- 📌 **Including and Excluding Outliers**: Box-and-whiskers plots can be drawn with or without the outliers to show the full range of the data or to highlight the outliers.
- 🔍 **Numerical Outlier Identification**: The video provides a numerical method to identify outliers as those numbers less than Q1 - 1.5*IQR or greater than Q3 + 1.5*IQR.
- 📋 **Practical Application**: The process demonstrated can be applied to any data set to objectively determine and visualize outliers.
Q & A
What is the main topic discussed in the transcript?
-The main topic discussed in the transcript is the identification and visualization of outliers in a set of 15 numbers using statistical methods and box-and-whiskers plots.
How many numbers are in the list that the instructor is discussing?
-There are 15 numbers in the list.
What is the median of the given list of numbers?
-The median of the given list of numbers is 14, which is the 8th number when arranged in order.
What is the first quartile (Q-one) of the given list of numbers?
-The first quartile (Q-one) is 13, which is the 4th number in the lower half of the dataset.
What is the third quartile (Q-three) of the given list of numbers?
-The third quartile (Q-three) is 18, which is the 4th number in the upper half of the dataset.
How is the interquartile range (IQR) calculated from the given data?
-The interquartile range (IQR) is calculated by subtracting Q-one from Q-three, which in this case is 18 - 13 = 5.
According to the rule mentioned, what is the definition of an outlier?
-An outlier is defined as any number that is more than one and a half times the interquartile range below Q-one or above Q-three.
What is the lower boundary for an outlier based on the IQR?
-The lower boundary for an outlier is Q-one minus 1.5 times the IQR, which calculates to 13 - 7.5 = 5.5.
What is the upper boundary for an outlier based on the IQR?
-The upper boundary for an outlier is Q-three plus 1.5 times the IQR, which calculates to 18 + 7.5 = 25.5.
How many outliers are there in the list according to the numerical definition provided?
-According to the numerical definition, there are two outliers in the list, both being the number 1.
What is a box-and-whiskers plot and how is it used in this context?
-A box-and-whiskers plot is a graphical representation of a dataset's quartiles, median, and potential outliers. In this context, it is used to visualize the distribution of the numbers and to highlight the outliers.
How can the box-and-whiskers plot be adjusted to either include or exclude outliers?
-The box-and-whiskers plot can be adjusted by setting the range from the first non-outlier to the last non-outlier (in this case, from 6 to 19) and then marking the outliers separately outside the whiskers of the box.
Outlines
📊 Identifying Outliers in a Data Set
The instructor begins by presenting a list of 15 numbers and introduces the concept of outliers. To visualize the distribution, the numbers are plotted on a number line, revealing the frequency of each number. The instructor discusses potential outliers, which some might consider to be the two ones and the single six. To establish a statistical consensus, the video explains the use of the interquartile range (IQR) to define outliers. The median (Q2), first quartile (Q1), and third quartile (Q3) are identified, and the IQR is calculated. Outliers are then defined as numbers more than 1.5 times the IQR below Q1 or above Q3. The instructor encourages viewers to pause and attempt the calculation before proceeding. The calculation shows that numbers less than 5.5 are considered outliers, confirming that only the two ones qualify as outliers in this context.
📈 Constructing a Box-and-Whiskers Plot
After defining outliers, the instructor moves on to creating a box-and-whiskers plot to represent the data set. The plot includes the median (Q2), Q1, and Q3, forming the 'box' of the plot. The instructor demonstrates two variations of the plot: one that includes all data points, including outliers, and another that excludes the outliers to focus on the main body of the data. The range of the plot is adjusted accordingly, with the non-outlier plot starting from six to highlight that the single six is not considered an outlier despite being less than Q1. The instructor emphasizes the flexibility of the box-and-whiskers plot, showing how it can be used to either include or exclude outliers for different analytical purposes.
Mindmap
Keywords
💡Outliers
💡Number Line
💡Interquartile Range (IQR)
💡Quartiles
💡Median
💡Box-and-Whiskers Plot
💡Statistical Analysis
💡Data Distribution
💡Rule of Thumb
💡Subjectivity
💡Data Visualization
Highlights
The instructor introduces a list of 15 numbers and discusses the concept of outliers.
Visualization of the number distribution on a number line is used to identify potential outliers.
The presence of multiple identical numbers (e.g., two ones, two 13s) in the dataset is noted.
The distribution's 'meat' or central area is identified as the key segment for outlier analysis.
Different perspectives on what constitutes an outlier are acknowledged, such as the inclusion or exclusion of the number six.
A statistical rule for identifying outliers is introduced, based on the interquartile range (IQR).
The median, Q1 (first quartile), and Q3 (third quartile) are calculated to determine the IQR.
The median is found to be the eighth number, which is 14, in this dataset.
Q1 is identified as the fourth number in the lower half of the dataset, which is 13.
Q3 is determined as the fourth number in the upper half of the dataset, which is 18.
The IQR is calculated as the difference between Q3 and Q1, resulting in a value of 5.
Outliers are defined as numbers below Q1 - 1.5 * IQR or above Q3 + 1.5 * IQR.
The numerical values for identifying outliers are calculated, with a lower bound of 5.5 and an upper bound of 25.5.
It is concluded that only the two ones are outliers based on the defined criteria.
The concept of box-and-whiskers plots is introduced for visual representation of the dataset.
Two methods of drawing box-and-whiskers plots are discussed: one including outliers and one excluding them.
The instructor demonstrates how to draw a box-and-whiskers plot, including the calculation of the box's range.
The final box-and-whiskers plot visually distinguishes between the dataset's non-outliers and outliers.
Transcripts
Browse More Related Video
How To Find The Interquartile Range & any Outliers - Descriptive Statistics

How To Make Box and Whisker Plots

Range | Interquartile Range (IQR) | Box and whisker plot
3.3.4 Measures of Relative Standing - Boxplots and Modified Boxplots
Boxplots in Statistics | Statistics Tutorial | MarinStatsLectures
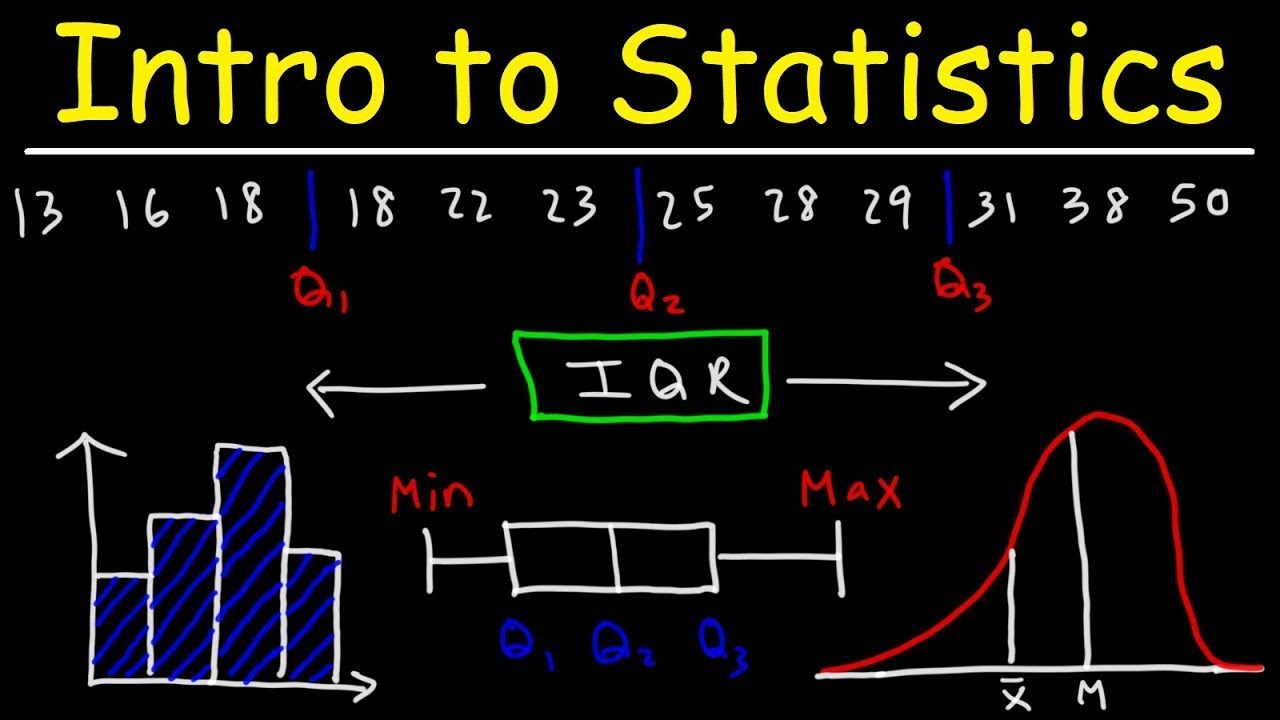
Introduction to Statistics
5.0 / 5 (0 votes)
Thanks for rating: