Range | Interquartile Range (IQR) | Box and whisker plot
TLDRThis video introduces the concepts of range and interquartile range (IQR) as measures of data dispersion. It explains how the range is calculated by subtracting the minimum value from the maximum, while IQR is found by subtracting the first quartile from the third. The video highlights the susceptibility of the range to outliers and the robustness of IQR, using a dataset and a box-and-whisker plot as visual aids. The example of ice cream flavors illustrates the practical application of these statistical measures, emphasizing the utility of IQR in providing a more accurate spread of data.
Takeaways
- 📊 The video discusses the concepts of 'range' and 'interquartile range' (IQR) as measures of dispersion in statistical data.
- 🔢 The 'range' is calculated by subtracting the minimum value from the maximum value in a dataset, indicating the overall spread.
- 📈 The 'interquartile range' (IQR) is found by subtracting the first quartile (Q1) from the third quartile (Q3), providing a measure of spread that is less affected by outliers.
- 🤔 The need for IQR arises because the range can be skewed by outliers, giving a false impression of data spread, whereas IQR is more robust against such anomalies.
- 📚 The video references a previous video on quantiles, which explains the concept of quartiles and their calculation.
- 🍦 An example using ice cream flavors and their sugar content illustrates the application of range and IQR in a real-world context.
- 📊 'Box-and-whisker plots' are introduced as a visual tool to represent the range and IQR, with the box representing the IQR and the whiskers extending to the minimum and maximum values.
- 👀 The video notes that some statistical software may adjust the whiskers to exclude outliers, depending on the software's criteria for identifying outliers.
- 📐 The box-and-whisker plot divides the data into quartiles, showing the distribution of data points across different ranges of values.
- 📝 The video provides a hypothetical example of calculating the range and IQR for ice cream scoops, emphasizing the plot's usefulness in understanding data distribution.
- 📚 The speaker invites viewers to visit Zstatistics.com for more statistical resources and videos, including further exploration of measures of spread.
Q & A
What is the main topic of the video?
-The main topic of the video is descriptive statistics, specifically focusing on the range and interquartile range (IQR).
What is the range in a dataset?
-The range is a measure of the spread of a dataset, calculated by subtracting the minimum value from the maximum value.
How is the interquartile range (IQR) defined?
-The interquartile range (IQR) is defined as the difference between the third quartile (Q3) and the first quartile (Q1) of a dataset.
Why is the interquartile range (IQR) useful compared to the range?
-The IQR is useful because it is not affected by outliers, providing a more accurate measure of the central spread of the dataset.
How can the range be misleading when there are outliers?
-The range can be misleading when there are outliers because it can suggest a larger spread than what is representative of most of the data points.
What is a box-and-whisker plot?
-A box-and-whisker plot is a graphical representation of a dataset's distribution, showing the minimum, maximum, first quartile, median, and third quartile.
What do the whiskers in a box-and-whisker plot represent?
-The whiskers in a box-and-whisker plot represent the minimum and maximum values of the dataset, excluding outliers if specified by the statistical software.
What does each section of a box-and-whisker plot represent?
-Each section of a box-and-whisker plot represents 25% of the data. The box shows the middle 50% (from Q1 to Q3), and the whiskers extend to the minimum and maximum values.
Why might some statistical packages exclude outliers in a box-and-whisker plot?
-Some statistical packages might exclude outliers to avoid skewing the visual representation of the data, providing a clearer view of the central distribution.
What example is used in the video to explain the concepts of range and IQR?
-The example used is assessing the grams of sugar in different flavors of ice cream, with fictional values to illustrate how the range and IQR can be calculated and visualized.
Outlines
📊 Introduction to Range and Interquartile Range
This paragraph introduces the topic of descriptive statistics, specifically focusing on range and interquartile range (IQR). The video aims to explain these concepts and their application in a box-and-whisker plot. The range is defined as the difference between the maximum and minimum values in a dataset, while the IQR is the difference between the third and first quartiles. The paragraph also mentions the potential issue with using range due to its susceptibility to outliers, which can give a misleading impression of data spread. The importance of IQR is highlighted as it provides a more accurate measure of spread by excluding extreme values.
🍦 Box-and-Whisker Plots and Outlier Impact
The second paragraph delves into the practical application of range and IQR through the example of ice cream flavors and their sugar content. It explains how a box-and-whisker plot visually represents the distribution of data, with the box representing the IQR and the whiskers extending to the minimum and maximum values. The paragraph clarifies that some statistical software may exclude outliers from the whiskers, which can affect the interpretation of range but not IQR. The summary also touches on the distribution of data within the quartiles, illustrating how the box-and-whisker plot can provide insights into the spread and concentration of data points, using the example of ice cream scoops with varying sugar content.
Mindmap
Keywords
💡Descriptive Statistics
💡Range
💡Interquartile Range (IQR)
💡Quartiles
💡Box-and-Whisker Plot
💡Outliers
💡Dispersion
💡Median
💡Data Set
💡Statistical Measures
💡Z-statistics.com
Highlights
Introduction to the concept of dispersion in statistics through range and interquartile range (IQR).
Explanation of the range as a simple statistical measure representing the spread of a dataset.
Definition of interquartile range (IQR) as the difference between the third and first quartiles.
Illustration of how to calculate range and IQR using an ordered dataset with seven elements.
Discussion on the susceptibility of range to outliers and its potential to misrepresent data spread.
Advantage of IQR over range in providing a more accurate measure of data spread without being affected by outliers.
Introduction to box-and-whisker plots as a visual tool for inspecting range and IQR.
Description of how quartiles are represented in a box-and-whisker plot with horizontal lines.
Explanation of how statistical packages may exclude outliers when drawing box-and-whisker plots.
Application of range and IQR in analyzing grams of sugar in different ice cream flavors.
Visual representation of ice cream flavors using a fictional box-and-whisker plot.
Calculation of range and IQR for the ice cream example to demonstrate their practical use.
Explanation of how box-and-whisker plots divide data into quartiles, each representing 25% of the dataset.
Insight into how box-and-whisker plots can provide a quick understanding of data distribution.
Introduction to upcoming videos on more robust statistical measures of spread.
Invitation to visit Zstatistics.com for more statistical resources and videos.
Encouragement for viewers to like, subscribe, and engage with the content for more insights.
Transcripts
Browse More Related Video
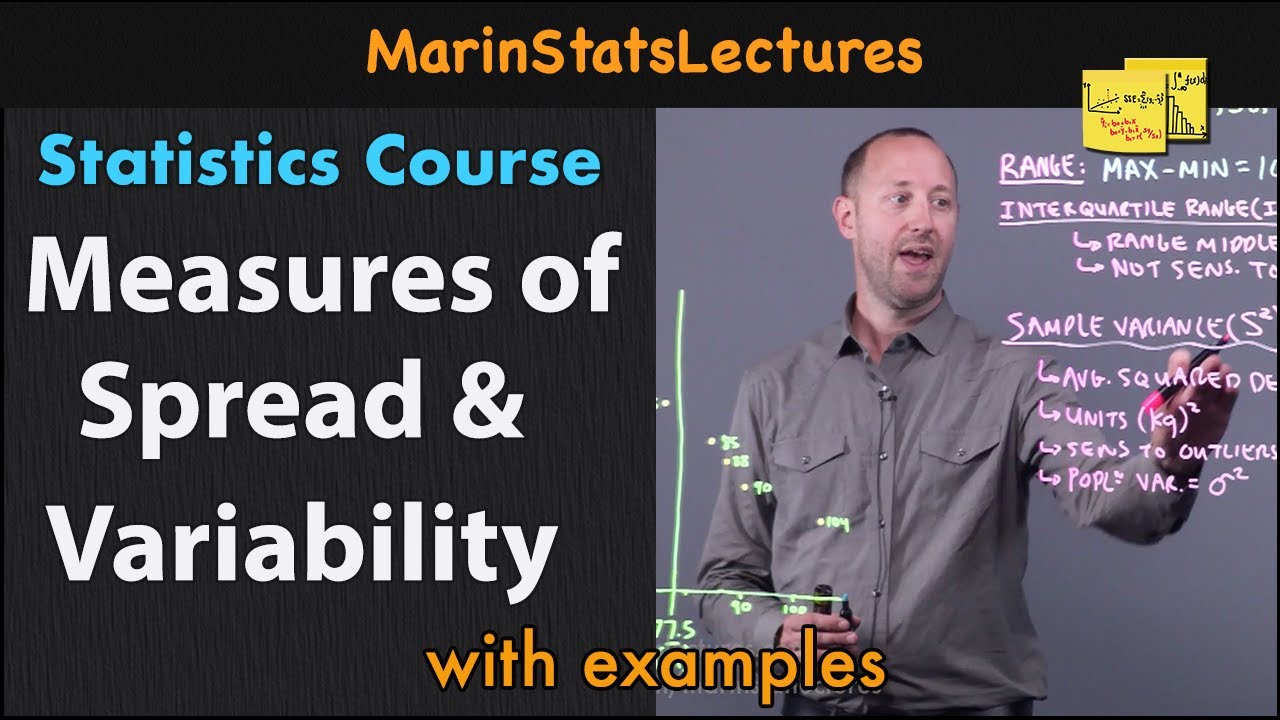
Measures of Spread & Variability: Range, Variance, SD, etc| Statistics Tutorial | MarinStatsLectures

How To Make Box and Whisker Plots
Judging outliers in a dataset | Summarizing quantitative data | AP Statistics | Khan Academy
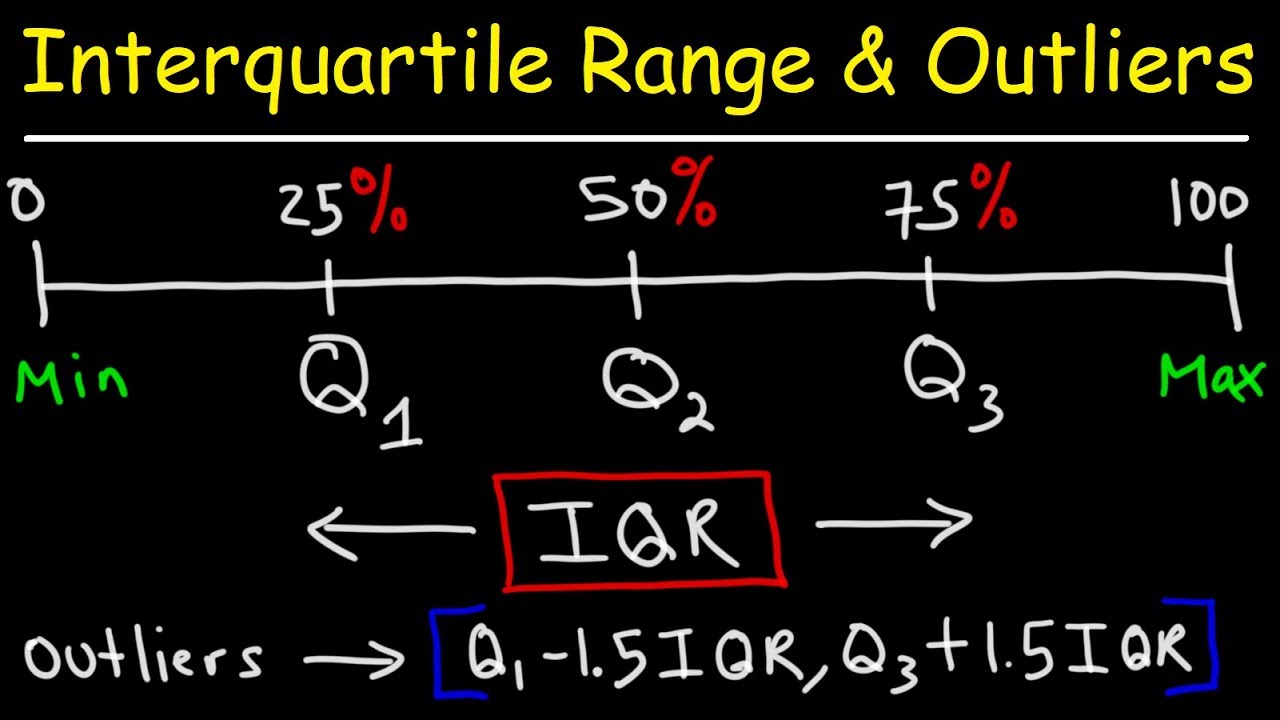
How To Find The Interquartile Range & any Outliers - Descriptive Statistics
How to calculate interquartile range IQR | Data and statistics | 6th grade | Khan Academy
Understanding Standard deviation and other measures of spread in statistics
5.0 / 5 (0 votes)
Thanks for rating: