Another example constructing box plot | Data and statistics | 6th grade | Khan Academy
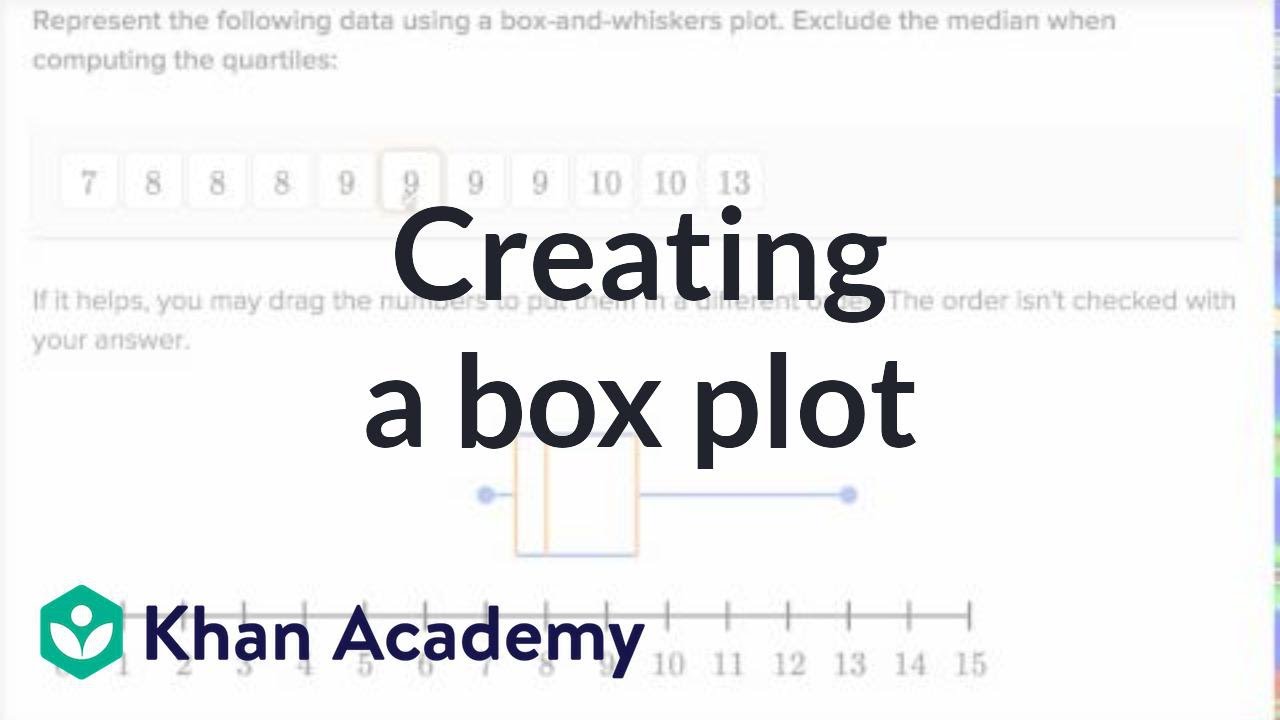
TLDRThe video script provides a step-by-step guide on creating a box-and-whiskers plot, emphasizing the exclusion of the median when calculating quartiles. The process begins with ordering the given data points from least to greatest, which in this case range from 1 to 10. The script then explains how to identify the median for an even set of numbers by taking the mean of the two middle numbers, resulting in a median of 4.5. Subsequently, the medians of the lower and upper halves of the data set are determined, excluding the overall median. The lower half's median is 2, and the upper half's median is 7, which are used to define the boundaries of the box in the plot. The whiskers extend from the minimum value (1) to the maximum value (10), visually representing the data's range. The completed box-and-whiskers plot effectively illustrates the central tendency and dispersion of the data points.
Takeaways
- 📈 Start by ordering the data points from least to greatest to prepare for the box-and-whiskers plot.
- 📊 Whiskers represent the range of the data, extending from the minimum to the maximum value.
- 🔢 For an even number of data points, the median is the mean of the two middle numbers.
- 🏁 The median of the entire dataset is 4.5 in this example, calculated by averaging the middle numbers, 4 and 5.
- ⚖️ Exclude the overall median when finding the median of the lower and upper halves of the data.
- 📌 The lower half's median (Q1) is the middle number with three on either side, which is 2 in this case.
- 📍 The upper half's median (Q3) is also the middle number of its half, which is 7 when considering the top half.
- 📏 The left boundary of the box (Q1) is determined by the median of the lower half.
- 📐 The right boundary of the box (Q3) is determined by the median of the upper half.
- 📋 The box-and-whiskers plot is a useful tool to visualize the spread and central tendency of a dataset.
- ✅ The script provides a step-by-step guide on how to construct a box-and-whiskers plot, emphasizing the process rather than the final answer.
Q & A
What is the purpose of a box-and-whiskers plot?
-A box-and-whiskers plot is used to visually represent the distribution of a data set. It shows the range, quartiles, and median of the data, providing a clear overview of the data's spread and central tendency.
Why might one exclude the median when computing the quartiles?
-Excluding the median when computing the quartiles can be done to focus on the spread of the data points around the median, rather than the median itself. This can be useful in certain statistical analyses where the median's influence on the quartiles is not of interest.
How does one order numbers for a box-and-whiskers plot?
-To create a box-and-whiskers plot, one must first order the data points from least to greatest. This ordering helps in identifying the minimum and maximum values, which are used to draw the whiskers, and also aids in finding the median and quartiles.
What is the range of the given data set in the transcript?
-The range of the given data set is from the lowest number, which is 1, to the highest number, which is 10. The range is a measure of the spread of the data and is represented by the whiskers in a box-and-whiskers plot.
How is the median calculated for an even number of data points?
-For an even number of data points, the median is calculated by taking the mean of the two middle numbers. In the given example, the middle two numbers are 4 and 5, so the median is the mean of these two numbers, which is 4.5.
What are the steps to find the median of the bottom half of numbers?
-To find the median of the bottom half of numbers, first identify the bottom half of the ordered data set. Then, find the middle number of this subset, which will have an equal number of data points on either side. In the transcript, the bottom seven numbers have a median of 2, as it is the fourth number with three numbers on either side.
How is the right boundary of the box in a box-and-whiskers plot determined?
-The right boundary of the box, also known as the third quartile, is determined by finding the median of the top half of the data set, excluding the overall median. In the example, the top half starts at 5 and goes up to 10, with the number 7 being the median of this subset, thus defining the right boundary of the box.
What does the box in a box-and-whiskers plot represent?
-The box in a box-and-whiskers plot represents the interquartile range (IQR), which is the range between the first quartile (25th percentile) and the third quartile (75th percentile). It shows where the middle 50% of the data lies, excluding the extreme values.
Why is it encouraged to use exercises on Khan Academy?
-Using exercises on Khan Academy is encouraged because they provide interactive learning experiences that allow users to practice and apply concepts, such as creating a box-and-whiskers plot, in a hands-on manner. It also offers immediate feedback through the 'check answer' feature.
What is the significance of the whiskers in a box-and-whiskers plot?
-The whiskers in a box-and-whiskers plot represent the range of the data set, extending from the minimum to the maximum data points. They help visualize the overall spread of the data and show the extent of the variation.
How does a box-and-whiskers plot help in data visualization?
-A box-and-whiskers plot helps in data visualization by providing a concise yet comprehensive summary of the data's distribution. It shows the median, quartiles, and range, allowing viewers to quickly grasp the central tendency, spread, and potential outliers of the data set.
What is the role of the median in a box-and-whiskers plot?
-In a box-and-whiskers plot, the median is represented by a line inside the box. It indicates the central value of the data set and separates the data into two halves. The median is particularly useful in understanding the distribution when the data is skewed.
Outlines
📊 Creating a Box-and-Whiskers Plot
The paragraph begins with an instruction to represent data using a box-and-whiskers plot, excluding the median when computing the quartiles. The speaker then arranges the provided data points in ascending order, from one to ten, to visualize the range. The median is calculated by taking the mean of the two middle numbers (four and five), resulting in four-and-a-half. The speaker further explains how to find the median of the bottom half (which is two) and the top half (which is seven), and uses these values to complete the box-and-whiskers plot, effectively illustrating the range and the middle half of the data set.
Mindmap
Keywords
💡Box-and-Whiskers Plot
💡Quartiles
💡Median
💡Data Points
💡Range
💡Whiskers
💡Khan Academy
💡Check Answer
💡
💡Ordered Numbers
💡Central Tendency
💡Statistical Analysis
💡Data Visualization
Highlights
Represent the data using a box-and-whiskers plot
Exclude the median when computing the quartiles
Order the data points from least to greatest
Plot the whiskers to visualize the range of the data
Find the median of the data set by taking the mean of the two middle numbers (4 and 5)
The median of the entire data set is 4.5
Exclude the overall median (4.5) when finding the medians of the bottom and top halves
The bottom half of the data has a median of 2
The left boundary of the box is determined by the median of the bottom half (2)
The top half of the data starts from 5 to 10
The median of the top half is 7
The right boundary of the box is determined by the median of the top half (7)
The box-and-whiskers plot visualizes the entire range of the data
It also shows the middle half of the data
The plot is useful for data analysis and interpretation
The process demonstrates how to create a box-and-whiskers plot step by step
The video provides a clear example using specific data points
It explains key concepts like median, quartiles, and range in a straightforward manner
The exercise helps reinforce understanding of box-and-whiskers plots and their components
Using Khan Academy exercises is a practical way to practice creating box-and-whiskers plots
Transcripts
Browse More Related Video
Box and whisker plot exercise example | Data and statistics | 6th grade | Khan Academy
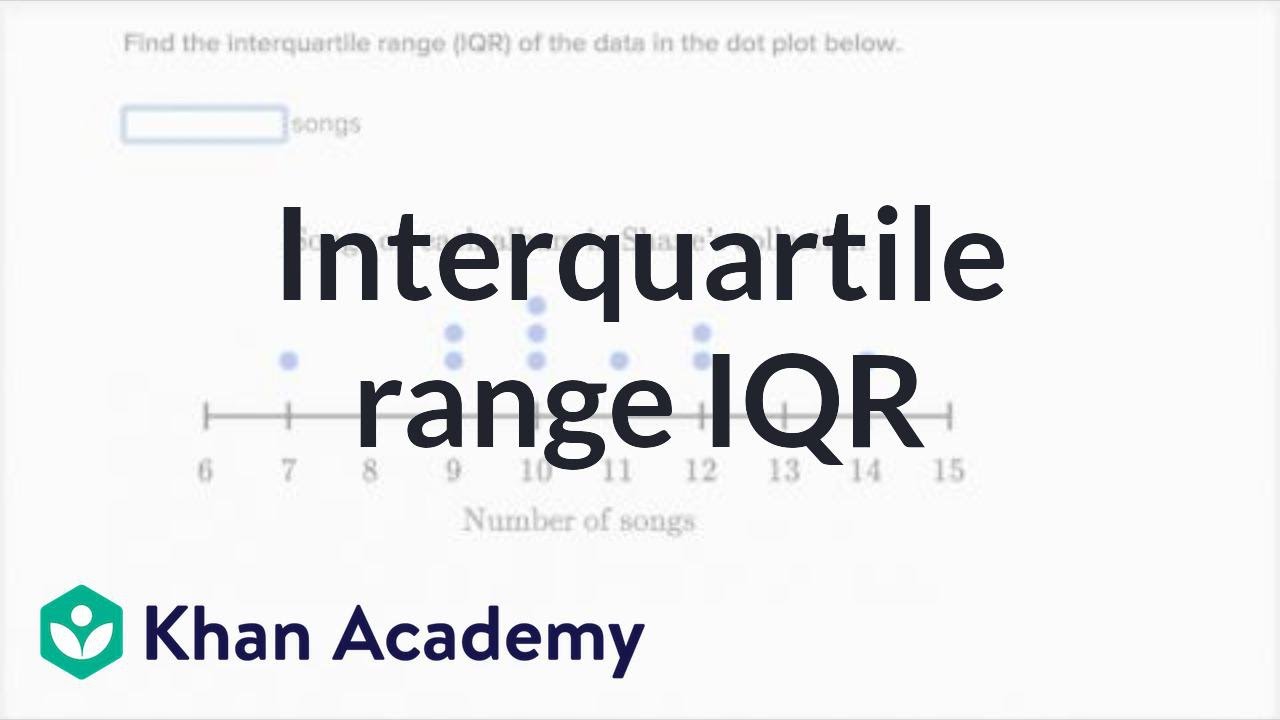
How to calculate interquartile range IQR | Data and statistics | 6th grade | Khan Academy
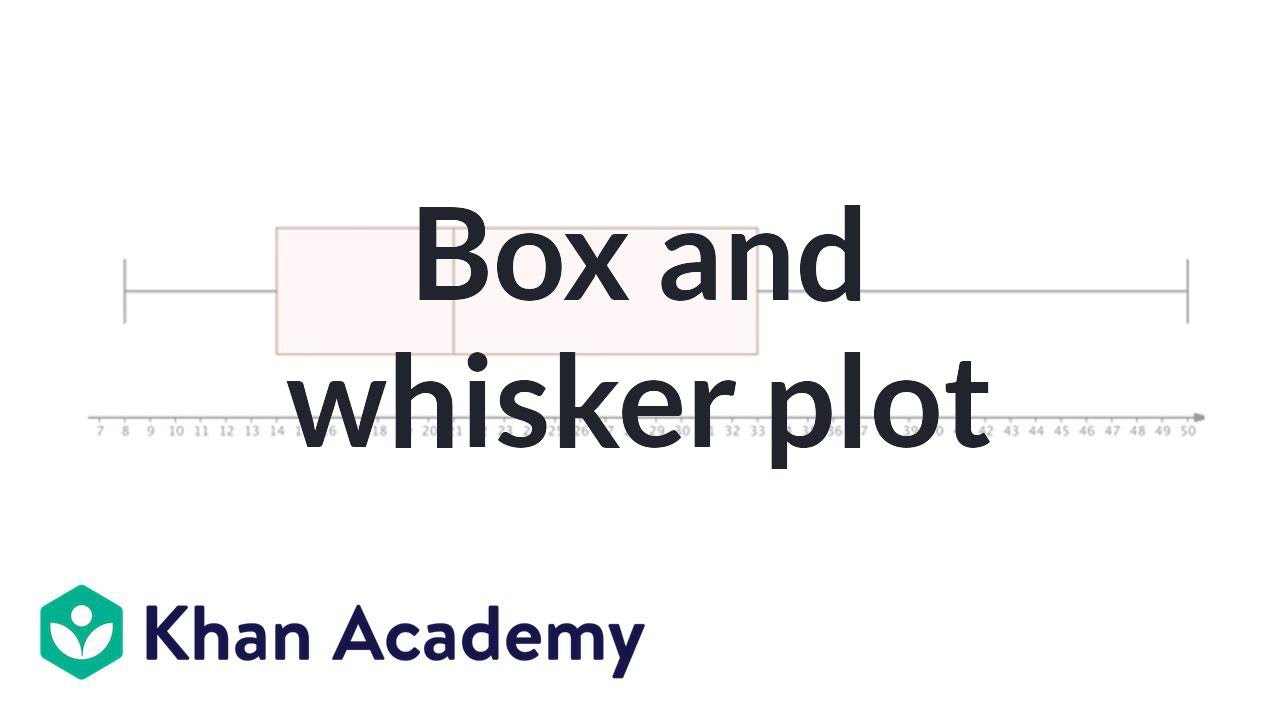
Box and whisker plot | Descriptive statistics | Probability and Statistics | Khan Academy
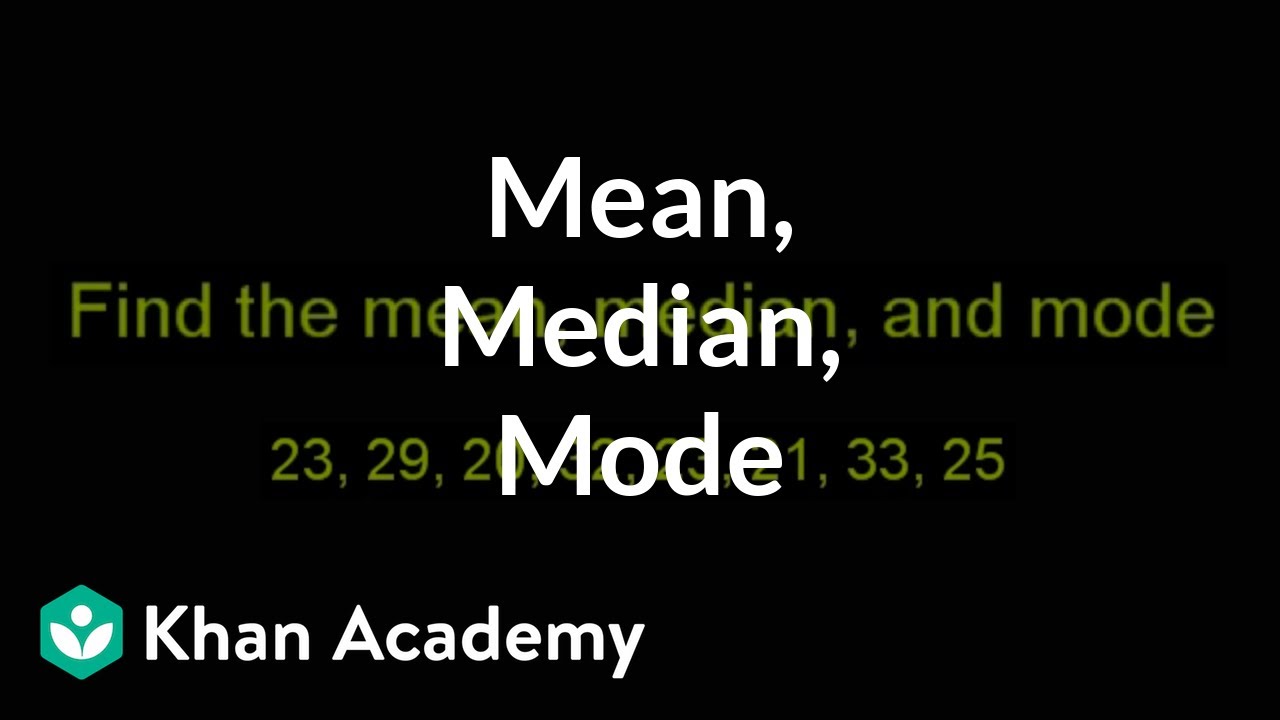
Finding mean, median, and mode | Descriptive statistics | Probability and Statistics | Khan Academy
Finding the Median | Math with Mr. J

How To Make Box and Whisker Plots
5.0 / 5 (0 votes)
Thanks for rating: