Box and whisker plot exercise example | Data and statistics | 6th grade | Khan Academy
TLDRThe video script provides a step-by-step guide on how to create a box-and-whiskers plot, emphasizing the importance of ordering data and understanding the range, median, and quartiles. The process begins by arranging the data set from smallest to largest, identifying the range between the lowest and highest numbers. The median, which is the middle value in an ordered data set, is then found and used as a reference point for the plot. The script clarifies that when calculating the quartiles, the median of the entire data set should be excluded. Quartiles are determined by finding the median of the lower half (resulting in the second quartile) and the upper half (resulting in the third quartile) of the data set. The video encourages viewers to practice this skill through exercises on Khan Academy, highlighting the platform's vast resource of 150,000 exercises for practice. The summary concludes with the completion of the box-and-whiskers plot, offering a clear and concise explanation of a complex statistical concept.
Takeaways
- 📊 To create a box-and-whiskers plot, first order the data to determine the range of numbers.
- 🔢 The smallest and largest numbers in the dataset define the whiskers of the plot.
- 🏁 The median is the middle number in an ordered dataset and serves as the central line of the box.
- 🎯 For an odd number of data points, the median is the single middle value.
- 🧮 For an even number of data points, the median is the mean of the two middle values.
- ⚖️ When calculating the quartiles, exclude the median from the dataset.
- 📈 The second quartile (bottom half) is determined by the median of the lower half of the data.
- 📉 The third quartile (top half) is determined by the median of the upper half of the data, excluding the overall median.
- 🛠️ The box in the box-and-whiskers plot represents the middle two quartiles of the data.
- 📚 Khan Academy offers extensive exercises for practicing statistical concepts, including median and quartiles.
- 💡 Practicing with real exercises is encouraged as it is the best way to learn and understand statistical plots.
Q & A
What is a box-and-whiskers plot?
-A box-and-whiskers plot, also known as a box plot, is a method of graphical representation for showing the distribution of data based on the five number summary: minimum, first quartile (Q1), median, third quartile (Q3), and maximum.
Why might one want to exclude the median when computing the quartiles?
-Excluding the median when computing the quartiles can be useful in certain statistical analyses where the goal is to see the spread of the data without the influence of the central tendency.
What is the first step in creating a box-and-whiskers plot?
-The first step is to order the data from smallest to largest number, which helps in identifying the range and the median.
How do you determine the range of numbers in the data set?
-The range is determined by identifying the smallest and largest numbers in the ordered data set.
What is the median in a data set with an odd number of observations?
-In a data set with an odd number of observations, the median is the middle number after sorting the data in ascending order.
What is the median of a data set with an even number of observations?
-In a data set with an even number of observations, the median is the mean of the two middle numbers after sorting the data.
How do you find the first quartile (Q1) in a box-and-whiskers plot?
-To find Q1, you locate the median of the lower half of the data set, excluding the overall median if it's part of the lower half.
How do you find the third quartile (Q3) in a box-and-whiskers plot?
-To find Q3, you locate the median of the upper half of the data set, excluding the overall median if it's part of the upper half.
What is the purpose of the whiskers in a box-and-whiskers plot?
-The whiskers represent the range of the data, extending from the minimum to the first quartile and from the third quartile to the maximum.
Why is it encouraged to practice creating box-and-whiskers plots?
-Practicing helps in understanding the distribution of data, the concept of quartiles, and enhances data visualization skills.
How many numbers are in the data set mentioned in the script?
-There are 11 numbers in the data set mentioned in the script.
What is the largest number in the data set from the script?
-The largest number in the data set is 13.
What is the smallest number in the data set from the script?
-The smallest number in the data set is 7.
What is the median of the entire data set in the script?
-The median of the entire data set is 9, as it is the middle number with five numbers on either side in the ordered list.
What is the median of the lower half of the data set in the script?
-The median of the lower half of the data set is 8, which is the middle number of the five ordered numbers below the overall median.
What is the median of the upper half of the data set in the script?
-The median of the upper half of the data set is 10, which is the middle number of the five ordered numbers above the overall median.
Outlines
📊 Understanding Box-and-Whiskers Plots
This paragraph introduces the concept of creating a box-and-whiskers plot for data representation, emphasizing the exclusion of the median when calculating quartiles. The speaker encourages the audience to order the data and use a mouse or pen tablet for interaction, suggesting the use of Khan Academy's exercises for practice. The process of ordering the data to find the range and identifying the smallest and largest numbers is described. The importance of the median and whiskers in defining the range and the box is highlighted.
Mindmap
Keywords
💡Box-and-Whiskers Plot
💡Median
💡Quartiles
💡Range
💡Whiskers
💡Data Ordering
💡Khan Academy
💡Interquartile Range (IQR)
💡Outliers
💡Measures of Central Tendency
💡Graphical Representation
💡Data Distribution
Highlights
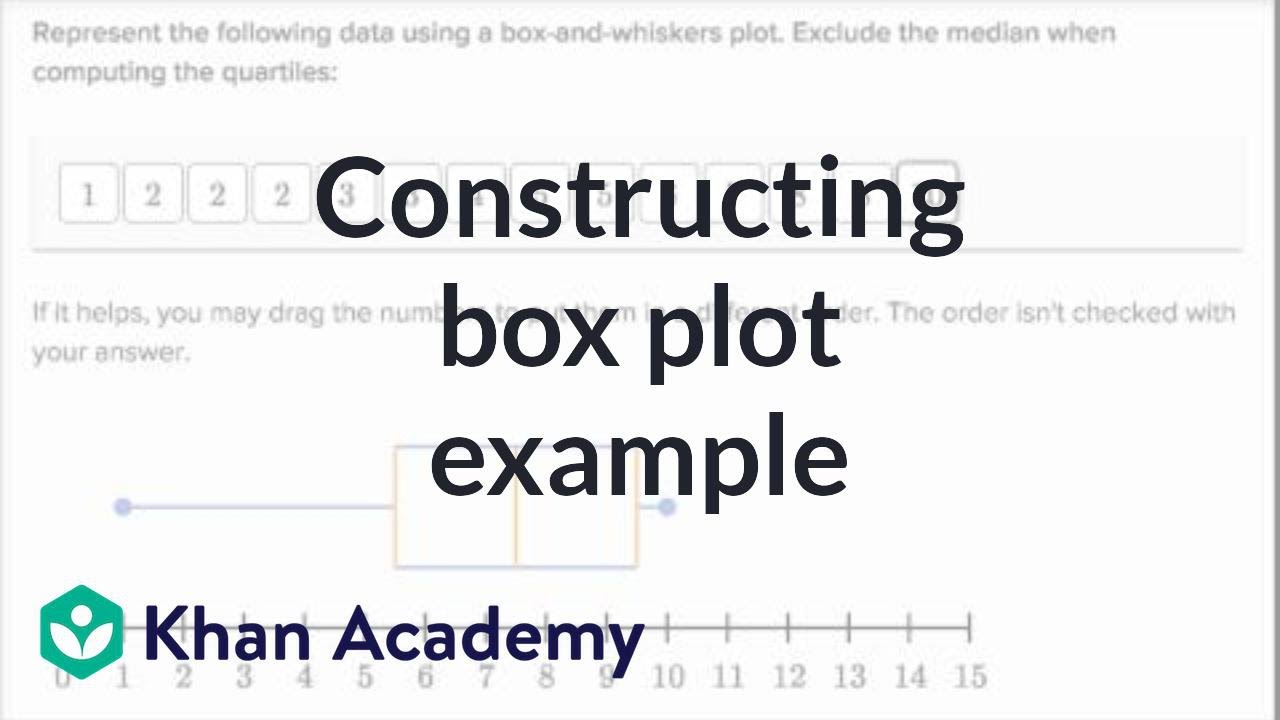
The task is to represent data using a box-and-whiskers plot while excluding the median when computing the quartiles.
The data can be rearranged for better organization, which is helpful for creating the plot.
Ordering the data helps in identifying the range of numbers, which is crucial for the plot's whiskers.
The smallest number in the dataset is seven, and the largest is 13, establishing the data's range.
The median is the middle number of the dataset when it is ordered, which is nine in this case.
For an even number of data points, the median would be the mean of the two middle numbers.
The video suggests using Khan Academy for more detailed explanations on calculating the median.
The median of the lower half of the dataset, excluding the overall median, is eight.
The second quartile begins at the median of the lower half, which is eight in this dataset.
The median of the upper half of the dataset, excluding the overall median, is 10.
The top of the second quartile is determined by the median of the upper half, which is 10.
Constructing the box-and-whiskers plot involves plotting the median and defining the quartiles.
Khan Academy offers 150,000 exercises for practicing statistical methods and understanding concepts.
Practicing with exercises is encouraged as it is the best way to learn and understand statistical concepts.
The box-and-whiskers plot is completed by identifying the range, median, and quartiles of the dataset.
Excluding the overall median from the calculation of quartiles is a specific requirement in this exercise.
The process of creating a box-and-whiskers plot involves several steps, including ordering data and finding medians.
The video provides a step-by-step guide on how to create a box-and-whiskers plot from a given dataset.
Transcripts
Browse More Related Video
Another example constructing box plot | Data and statistics | 6th grade | Khan Academy
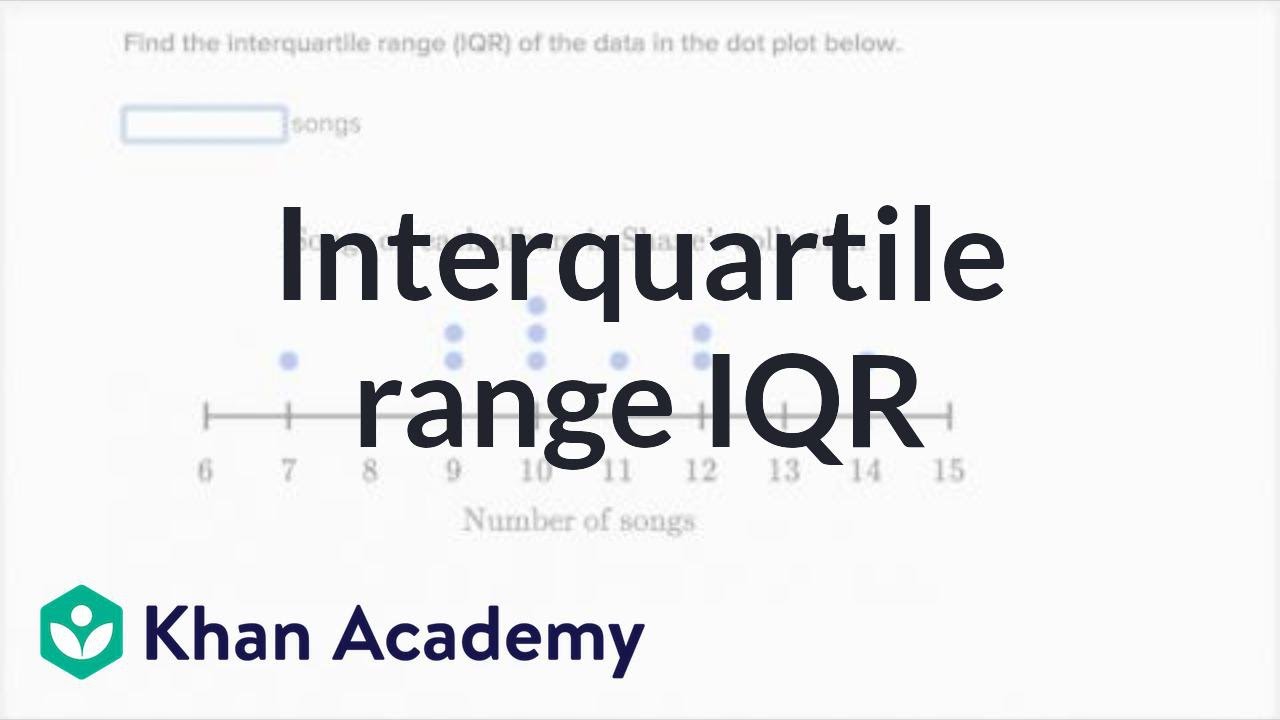
How to calculate interquartile range IQR | Data and statistics | 6th grade | Khan Academy
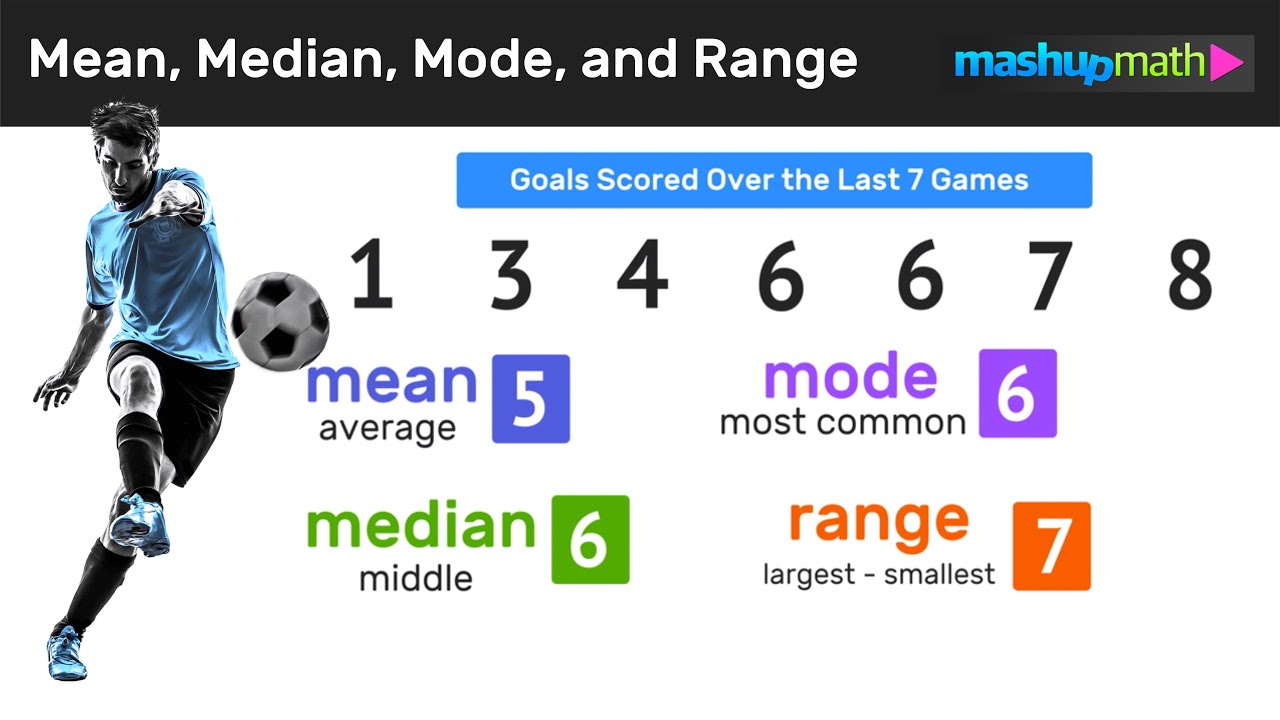
How to Find the Mean, Median, Mode, and Range

How To Make Box and Whisker Plots
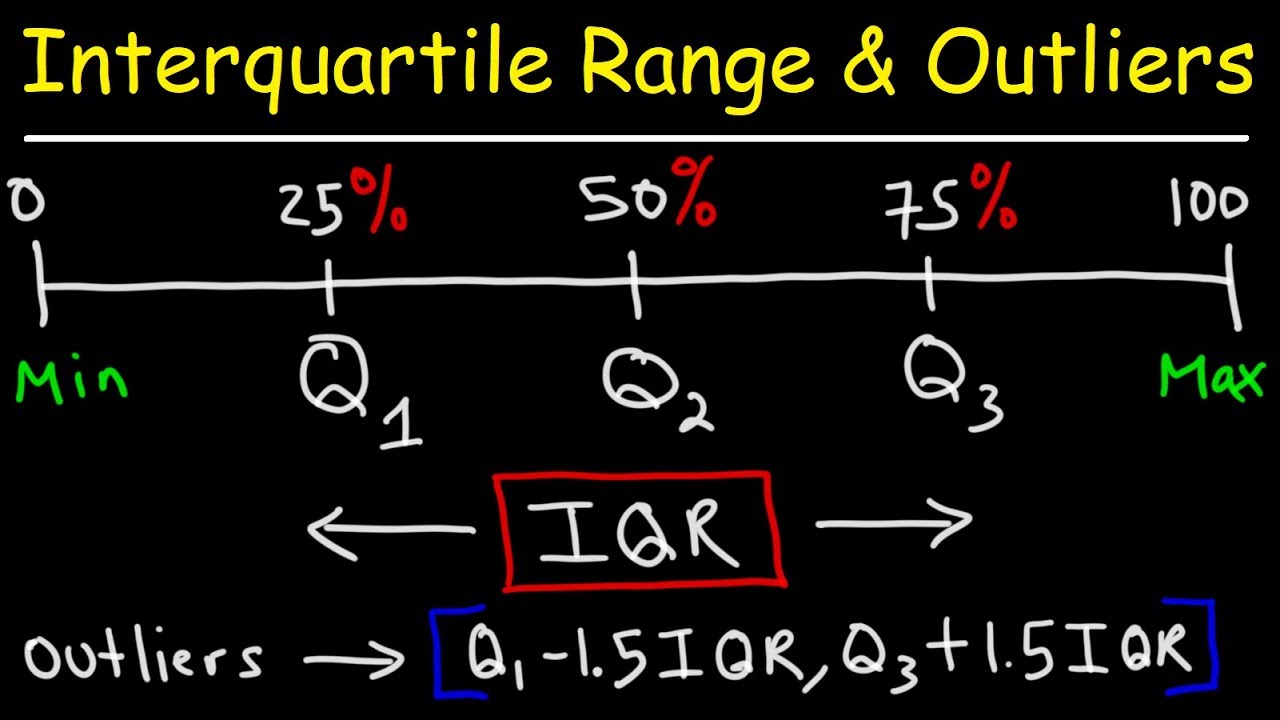
How To Find The Interquartile Range & any Outliers - Descriptive Statistics
Box and whisker plot | Descriptive statistics | Probability and Statistics | Khan Academy
5.0 / 5 (0 votes)
Thanks for rating: