Box and whisker plot | Descriptive statistics | Probability and Statistics | Khan Academy
TLDRThe video script discusses the use of a box-and-whisker plot to analyze the age distribution of approximately 100 trees in a local forest. The plot is a visual representation of the spread of data points, with the whiskers indicating the range from the youngest (8 years) to the oldest (50 years) tree, resulting in a range of 42 years. The box within the plot represents the interquartile range, with the median age of the trees at 21 years, which is closer to the lower end of the age spectrum. The script explains the concept of quartiles, dividing the data into four parts, each representing a quarter of the trees' ages. This summary provides an engaging overview, highlighting the key insights gained from the box-and-whisker plot about the central tendency and distribution of tree ages in the forest.
Takeaways
- 📊 A box-and-whisker plot is a graphical representation used to show the distribution of data points, in this case, the ages of trees.
- 🌲 The whiskers in the plot represent the range of the data, from the youngest to the oldest tree, which is from 8 to 50 years.
- 📉 The range of tree ages is calculated by subtracting the lowest data point from the highest, resulting in a 42-year range.
- 📈 The median age of the trees, which is the middle value, is indicated as 21 years, meaning half of the trees are younger and half are older.
- 📌 The box in the plot represents the interquartile range, splitting the data into four equal parts or quartiles.
- 📉 The first quartile (Q1) includes the median of the lower half of the data, which is between 14 and 21 years.
- 📈 The second quartile is the median itself, which is at 21 years, representing the middle of the entire dataset.
- 📉 The third quartile includes the median of the upper half of the data, which is between 21 and 33 years.
- 📚 The box-and-whisker plot provides a clear visualization of the central tendency and spread of the tree ages in the forest.
- 🔢 The plot divides the data into four parts, aiding in understanding where the majority of the tree ages lie within the dataset.
- ℹ️ Despite the presence of trees as old as 50 years, the median age is closer to the lower end of the age spectrum, indicating a skew towards younger trees.
Q & A
What is the main purpose of a box-and-whisker plot?
-A box-and-whisker plot is a method used to visualize the distribution of data points. It shows the spread of data, identifies the median, and indicates where most of the data points lie.
What does the range of tree ages represent in the context of the plot?
-The range represents the difference between the oldest and youngest tree ages in the sample, which is calculated by subtracting the lowest data point from the highest.
What is the range of tree ages according to the ecologist's data?
-The range of tree ages is 42 years, from the youngest tree at 8 years old to the oldest at 50 years.
What does the median age of a tree in the forest indicate?
-The median age of a tree in the forest, which is 21 years, indicates the middle value when all tree ages are arranged in ascending order. Half of the trees are younger, and half are older than this age.
How does the box in the box-and-whisker plot relate to the median?
-The box in the plot starts with a line that represents the median. It shows that half of the tree ages are below this line and the other half are above it.
What are the quartiles in a box-and-whisker plot?
-Quartiles divide the data into four equal parts. The first quartile (Q1) represents the median of the lower half of the data, the second quartile is the overall median, the third quartile (Q3) is the median of the upper half of the data, and the fourth quartile represents the highest values.
What does the first quartile (Q1) signify in the plot?
-The first quartile (Q1) signifies the median of the lower half of the data. In this case, it represents the middle value of the trees that are less than the overall median age of 21 years.
What is the significance of the whiskers in a box-and-whisker plot?
-The whiskers show the spread of the data points outside the box. They indicate the range of the smallest and largest values, excluding any outliers, and provide a sense of the overall dispersion of the data.
How does the position of the median within the box indicate the distribution of the data?
-The position of the median within the box can indicate if the data is symmetrically distributed or skewed. If the median is closer to one end of the box, it suggests that the data is skewed towards the higher or lower values.
What is the difference between the median and the mean age of the trees?
-The median is the middle value when the ages are arranged in order, whereas the mean is the average age calculated by summing all the ages and dividing by the number of trees. The median is less sensitive to extreme values and provides a better central tendency measure when the data is skewed.
How can the information from the box-and-whisker plot be used to understand the age distribution of the forest?
-The box-and-whisker plot provides a visual summary of the age distribution, showing the central tendency, spread, and potential skewness of the data. It allows for a quick assessment of the typical age of trees, the variability in ages, and the presence of any age groups that are significantly different from the majority.
Can you identify outliers using a box-and-whisker plot?
-Yes, outliers can often be identified as data points that lie outside the whiskers. However, the specific method for identifying outliers can vary and may require setting a certain threshold beyond the whiskers or using other statistical techniques.
Outlines
🌳 Understanding Box-and-Whisker Plots in Ecology
The paragraph introduces the use of a box-and-whisker plot by an ecologist to analyze the age distribution of approximately 100 trees in a local forest. The plot is explained as a visual representation of the spread of data points, which in this case are the ages of the trees. It includes the median (the middle value), the range (the difference between the oldest and youngest trees), and the quartiles (dividing the data into four equal parts). The key takeaway is that the range of tree ages is from 8 to 50 years, with a median age of 21 years, indicating that while there are trees as old as 50 years, the central tendency of the forest's tree ages is closer to the lower end.
Mindmap
Keywords
💡Ecologist
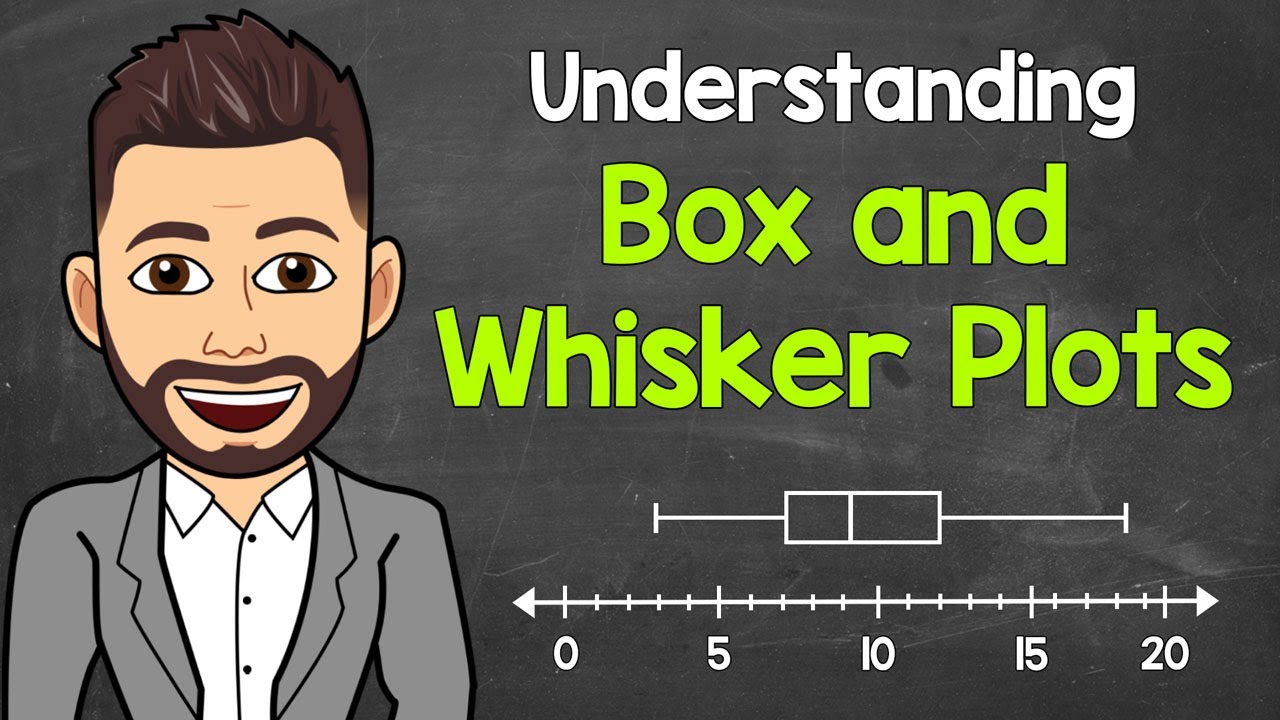
💡Box-and-Whisker Plot
💡Range
💡Median
💡Whiskers
💡Quartiles
💡First Quartile (Q1)
💡Second Quartile (Q2)
💡Third Quartile (Q3)
💡Data Point
💡Central Tendency
Highlights
An ecologist surveys the age of about 100 trees in a local forest using a box-and-whisker plot.
The box-and-whisker plot is a method to visualize the spread of data points, in this case, the ages of trees.
The whiskers of the plot represent the range of tree ages, from the lowest to the highest data point.
The lowest tree age in the sample is eight years, and the highest is fifty years.
The range of tree ages surveyed is 42 years, calculated as the difference between the oldest and youngest trees.
The median age of a tree in the forest is 21 years, indicating the central tendency of the data.
Half of the tree ages are less than 21 years, and half are older than 21 years.
The box-and-whisker plot splits the data into four groups, known as quartiles.
The first quartile (Q1) represents a fourth of the trees with ages between 14 and 21 years.
The second quartile includes trees with ages between 21 and 33 years.
The third quartile encompasses the middle group of tree ages.
The fourth quartile represents the highest 25% of tree ages.
The median is closer to the lower end of the age spectrum, showing a central tendency towards younger trees.
The plot visually demonstrates the distribution of tree ages with the median, quartiles, and range.
The median age of 21 years is a significant finding as it reflects the age where half of the trees are younger and half are older.
The range and median provide a comprehensive understanding of the age distribution of trees in the forest.
The box-and-whisker plot is a useful tool for understanding the central tendency and dispersion of a dataset.
The ecologist's findings can be applied to various forestry and ecological studies for better resource management.
Transcripts
Browse More Related Video
Box and Whisker Plots Explained | Understanding Box and Whisker Plots (Box Plots) | Math with Mr. J
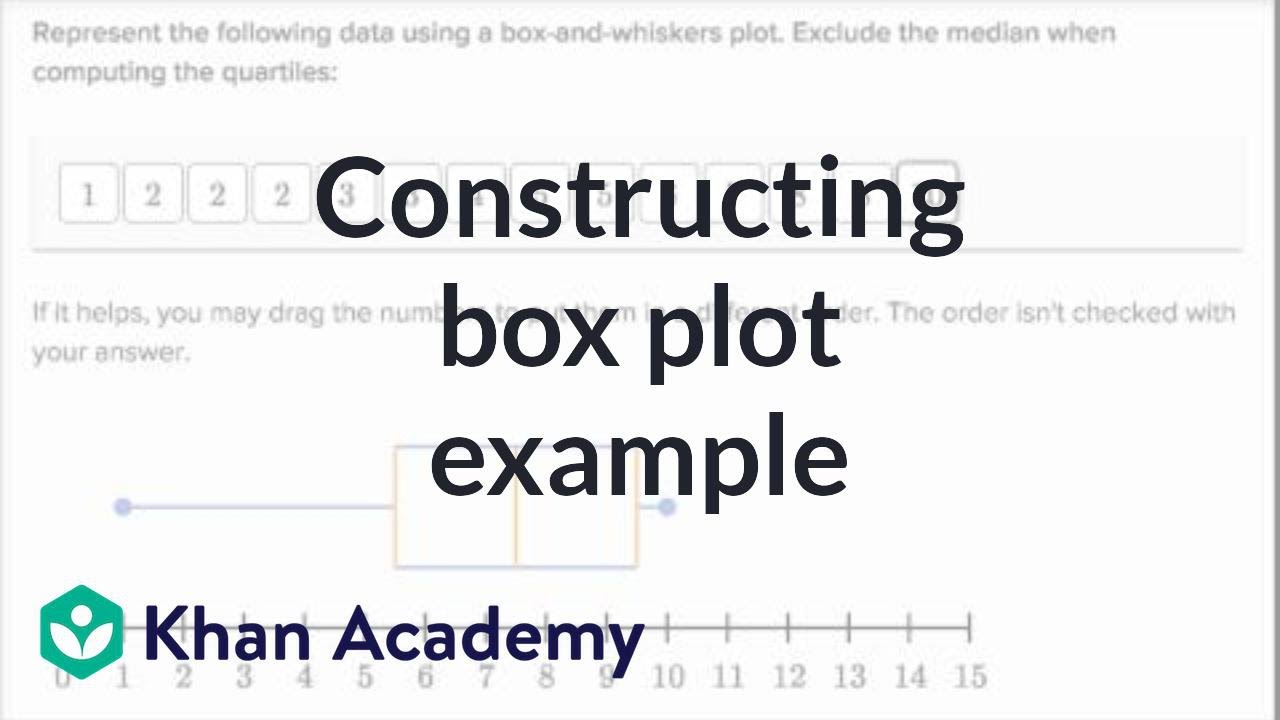
Another example constructing box plot | Data and statistics | 6th grade | Khan Academy

How To Make Box and Whisker Plots
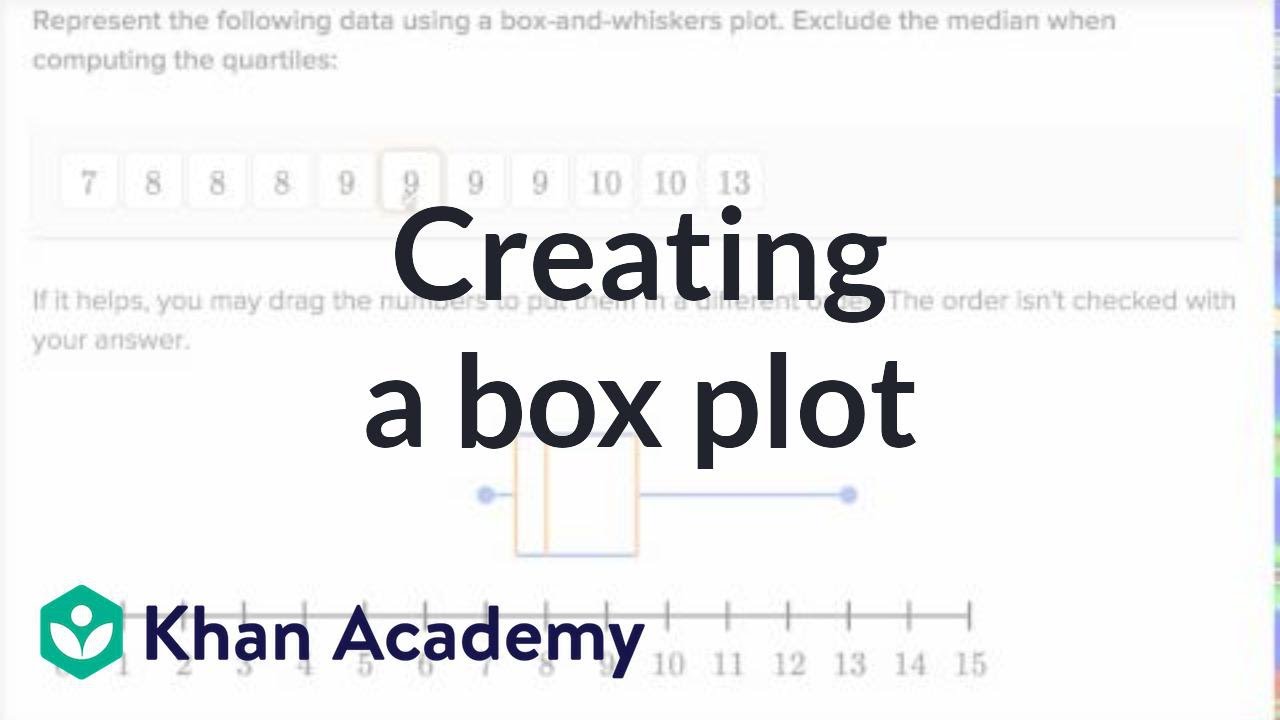
Box and whisker plot exercise example | Data and statistics | 6th grade | Khan Academy

Range | Interquartile Range (IQR) | Box and whisker plot
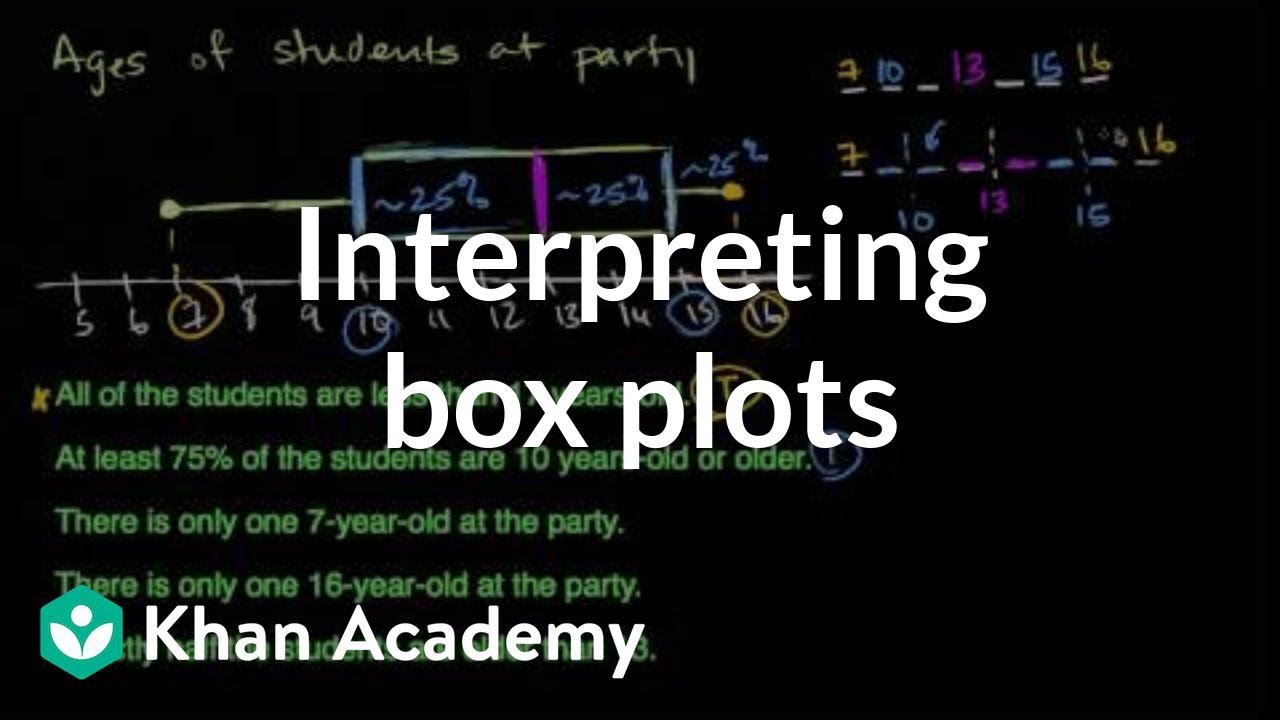
Interpreting box plots | Data and statistics | 6th grade | Khan Academy
5.0 / 5 (0 votes)
Thanks for rating: