Finding the Median | Math with Mr. J
TLDRIn this educational video, Mr. J. explains the concept of the median as a measure of central tendency, which represents a data set with a single number. He demonstrates how to find the median by organizing data sets in ascending order and identifying the middle value. For an odd number of data points, the median is the central number, as illustrated with a baseball team's runs scored. For an even number of data points, the median is the average of the two central numbers, exemplified by the employees' ages. The video effectively teaches the process of calculating the median in both scenarios.
Takeaways
- 📚 The median is a measure of central tendency, representing a data set with a single number.
- 🔢 To find the median, first arrange the data set in ascending order.
- 🔄 For an odd number of data points, the median is the middle number after sorting.
- 📈 In the example with baseball runs, the data set was sorted and the median found to be 4 runs.
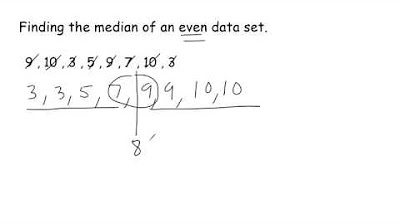
- 📊 When the data set has an even number of values, the median is the average of the two middle numbers.
- 👥 In the employee ages example, the median was calculated as the average of 35 and 42, resulting in 38.5 years.
- 🧩 The median effectively splits the data set into two equal halves.
- 📝 The process of finding the median involves counting or identifying the middle value(s) in a sorted list.
- ⚖️ The median is a useful statistic for summarizing data, especially when dealing with skewed distributions.
- 📉 Understanding the median helps in analyzing and comparing data sets, providing insights into central tendencies.
- 👨🏫 Mr. J's video tutorial clearly demonstrates the step-by-step process of finding the median in different scenarios.
Q & A
What is the median in statistics?
-The median is the middle value of a data set when it is ordered from least to greatest. It is a measure of central tendency, which means it represents the data set with a single number.
Why is the median considered a measure of central tendency?
-The median is considered a measure of central tendency because it provides a single value that summarizes and represents the entire data set, similar to the mean and mode.
How do you determine the median for a data set with an odd number of values?
-For a data set with an odd number of values, you order the data and find the middle value. This value is the median, as it splits the data in half.
What is the process for finding the median of the baseball team's runs scored data set in the video?
-First, the data is ordered from least to greatest. Since there are 13 values (an odd number), the median is the middle value, which is 4 in this case.
How many runs did the baseball team score in the median game according to the video?
-The baseball team scored 4 runs in the median game of their season.
What happens when you have an even number of values in a data set and need to find the median?
-When there is an even number of values, you find the two middle numbers, calculate their mean (average), and that result is the median.
In the video, what is the median age of the employees at the business?
-The median age of the employees is 38.5 years, which is the average of the two middle values, 35 and 42.
Why is it necessary to calculate the mean of the two middle numbers when the data set has an even number of values?
-Calculating the mean of the two middle numbers ensures that the median accurately represents the center of the data set when there is no single middle value.
What is the significance of the median in summarizing a data set?
-The median is significant because it provides a central value that divides the data set into two equal halves, offering a quick summary of the data distribution.
Can the median be influenced by extreme values or outliers in a data set?
-Unlike the mean, the median is less influenced by extreme values or outliers because it is based on the middle position of the data set rather than the sum of all values.
How does the process of finding the median differ between ordered and unordered data sets?
-For unordered data sets, the first step is to order the data from least to greatest before identifying the middle value(s). For ordered data sets, you can directly identify the median without the need for ordering.
Outlines
📊 Understanding Median in Data Sets
In this educational segment, Mr. J introduces the concept of the median as a measure of central tendency, which is a single value that represents a set of numbers. He explains that the median is the middle value in a data set, and if the set is ordered, this value can be found directly. The video provides a step-by-step example using the number of runs scored by a baseball team throughout a season. The data is first ordered, revealing that with 13 values, the median is the 7th value, which is 4 runs. This example illustrates the process of finding the median in a data set with an odd number of values.
📈 Calculating Median with Even Number of Values
Continuing the lesson, Mr. J addresses the scenario where a data set contains an even number of values, using the example of employees' ages at a business. The data is already ordered, and with 10 values, the median is determined by averaging the two middle numbers, 35 and 42. The calculation results in a median age of 38.5 years. This part of the video demonstrates the method of finding the median when there is an even number of data points, emphasizing the need to calculate the mean of the two central values.
👋 Closing Remarks and Sign Off
Mr. J concludes the video with a brief thank you to the viewers for watching and a casual sign-off, expressing hope that the information was helpful. He looks forward to the next video, ending the session on a friendly and positive note.
Mindmap
Keywords
💡Median
💡Central Tendency
💡Data Set
💡Order from Least to Greatest
💡Odd Number of Values
💡Even Number of Values
💡Runs
💡Ages
💡Mean
💡Summarize
Highlights
Introduction to the concept of median as a measure of central tendency.
Median defined as the middle value of a data set.
Explanation of central tendency and its relation to summarizing data sets.
Mean, median, and mode as examples of measures of central tendency.
Demonstration of finding the median with an ordered data set.
Step-by-step guide to ordering data from least to greatest.
Example of a baseball team's runs scored data set.
Method of identifying the middle value in an ordered data set.
Calculation of the median for a data set with an odd number of values.
Identification of the median as the value that splits the data in half.
Transition to finding the median in a data set with an even number of values.
Example of employee ages data set with an even number of values.
Process of finding the mean of two middle values for an even data set.
Calculation of the median as the average of the two central values.
Final median value calculation for the employee ages example.
Explanation of the median's role in splitting the data set into two equal halves.
Conclusion summarizing the method of finding the median.
Closing remarks and thanks for watching the video.
Transcripts
Browse More Related Video

How to Find the Median | Math with Mr. J
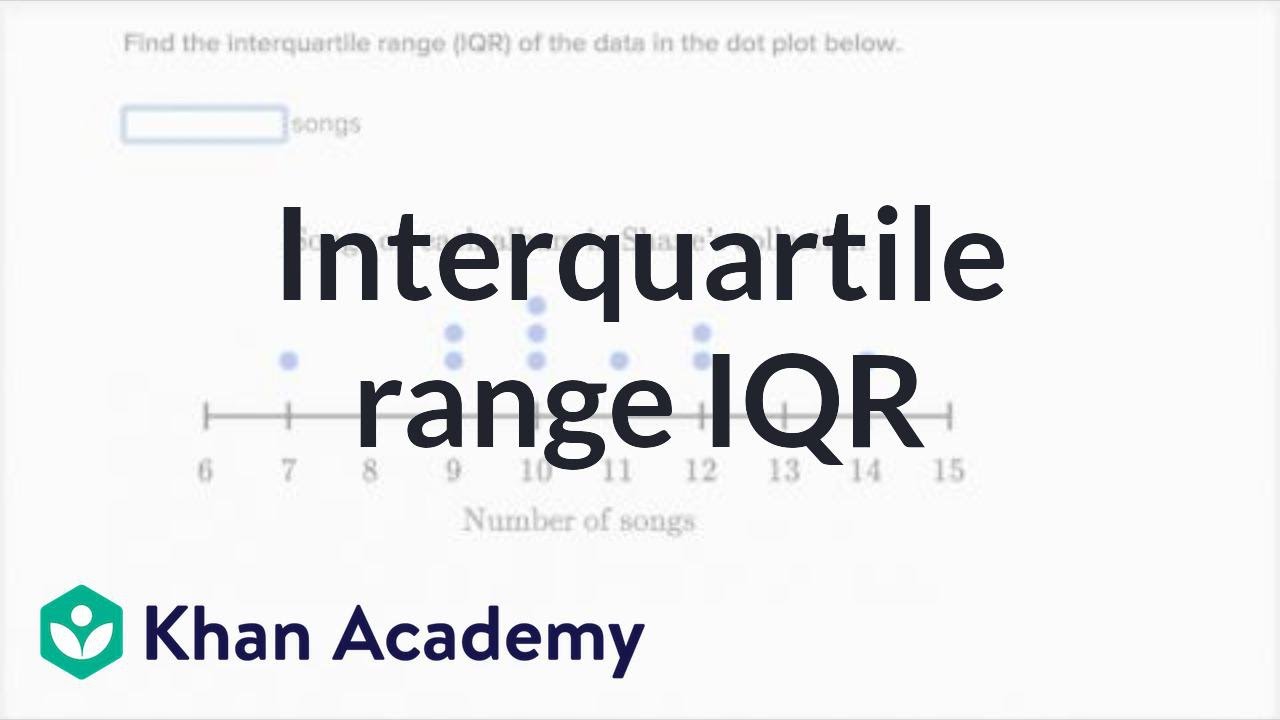
How to calculate interquartile range IQR | Data and statistics | 6th grade | Khan Academy
How To Find The Median Of A Data Set

How do we Find the Median? | Don't Memorise
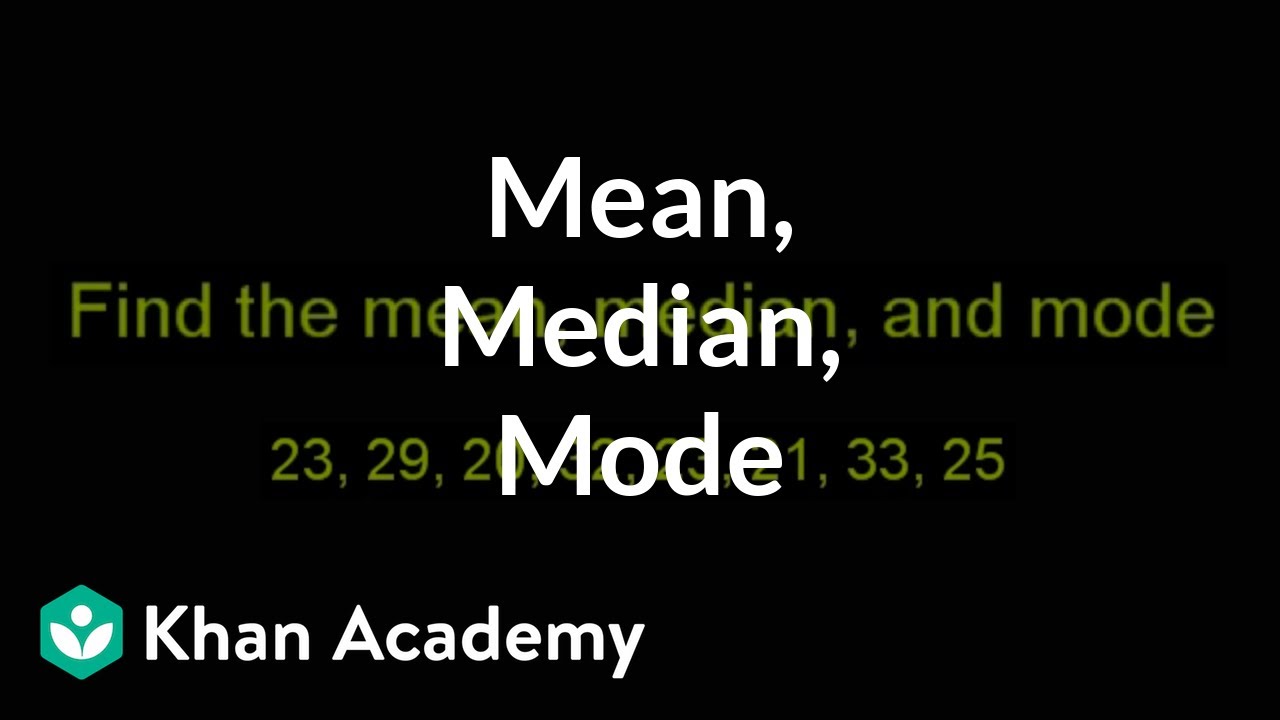
Finding mean, median, and mode | Descriptive statistics | Probability and Statistics | Khan Academy
Why do we Need the Median? - Example | Don't Memorise
5.0 / 5 (0 votes)
Thanks for rating: