How to calculate interquartile range IQR | Data and statistics | 6th grade | Khan Academy
TLDRThe video script outlines a step-by-step guide on calculating the interquartile range (IQR) from a given data set. The process begins with sorting the data points in ascending order. The median, or the middle number, is identified next, which is crucial for IQR calculation. For an odd number of data points, the median is the central value, while for an even number, it's the average of the two central values. The IQR is then determined by finding the median of the lower and upper halves of the data set, excluding the median of the entire set, and calculating the difference between these two medians. The script provides two examples: the first involves animal crackers in lunch boxes, and the second concerns the number of songs on music albums. Each example demonstrates how to find the median and subsequently the IQR, emphasizing the IQR's role as a measure of data spread. The summary effectively conveys the method's simplicity and its significance in statistical analysis.
Takeaways
- 📝 **Sorting Data**: To find the interquartile range (IQR), first sort the data set from least to greatest.
- 🔢 **Finding the Median**: The median is the middle number in an odd-sized data set or the average of the two middle numbers in an even-sized data set.
- 📊 **Identifying Quartiles**: The IQR is the measure of the spread between the middle 50% of the data, which is found by calculating the difference between the median of the second half and the median of the first half.
- 🏷️ **First Quartile (Q1)**: The median of the first half of the data set, excluding the overall median if the data set is even-sized.
- 🏷️ **Third Quartile (Q3)**: The median of the second half of the data set.
- ➗ **Calculating IQR**: Subtract the first quartile (Q1) from the third quartile (Q3) to find the interquartile range.
- 📈 **Even Number of Data Points**: When the data set has an even number of points, the median is the average of the two middle numbers.
- 📉 **Odd Number of Data Points**: With an odd number of data points, the median is the single middle number.
- 🚫 **Excluding the Overall Median**: When calculating Q1 and Q3, exclude the overall median if the data set is even-sized.
- 📚 **Practice with Examples**: Practicing with different data sets, like the number of animal crackers or songs on albums, helps solidify the understanding of calculating IQR.
- 🎓 **Educational Value**: The process of calculating IQR is a fundamental statistical skill that helps understand the spread of data.
Q & A
What is the purpose of calculating the interquartile range (IQR)?
-The interquartile range is a measure of statistical dispersion, or spread, that describes the difference between the first quartile (25th percentile) and the third quartile (75th percentile) in a data set. It is used to understand the variability in the middle 50% of the data.
How does one sort the data to find the IQR?
-To find the IQR, one must first sort the data from least to greatest. This can be done manually or by using a sorting tool if available.
What is the median in a data set with an odd number of values?
-In a data set with an odd number of values, the median is the middle number. It is the value that has an equal number of data points on either side.
How is the median calculated when there is an even number of values?
-When there is an even number of values, the median is calculated by taking the average of the two middle numbers in the sorted data set.
What does the first quartile represent in the context of IQR?
-The first quartile (Q1) represents the median of the first half of the data set, which is the 25th percentile. It is the value below which 25% of the data falls.
What does the third quartile represent in the context of IQR?
-The third quartile (Q3) represents the median of the second half of the data set, which is the 75th percentile. It is the value below which 75% of the data falls.
How is the IQR calculated?
-The IQR is calculated by subtracting the first quartile (Q1) from the third quartile (Q3). It gives a measure of the spread of the middle 50% of the data.
What does a larger IQR value indicate about the data set?
-A larger IQR value indicates that the middle 50% of the data is more spread out, suggesting greater variability or dispersion within the data set.
What does a smaller IQR value indicate about the data set?
-A smaller IQR value indicates that the middle 50% of the data is closer in value to each other, suggesting less variability or dispersion within the data set.
How does the instructor in the script find the median of the first and second halves of the data?
-The instructor finds the median of the first half by calculating the average of the two middle numbers in the lower half of the data set. For the second half, the median is the middle number since there are an odd number of values in the upper half.
In the second example provided in the script, what is the median of the data set?
-In the second example, the median of the data set is 10, as it is the average of the two middle numbers when the data set is sorted in ascending order.
What is the IQR of the second example in the script?
-The IQR of the second example is 3, which is the difference between the third quartile (Q3) of 12 and the first quartile (Q1) of 9.
Outlines
📊 Calculating Interquartile Ranges with Animal Crackers
The instructor begins by introducing the concept of interquartile ranges (IQR), using a dataset of animal crackers in kids' lunch boxes as an example. The data points are sorted in ascending order, revealing the sequence: 4, 4, 4, 6, 7, 10, 11, 12, 14, and 15. The median, being the middle number in this odd-numbered dataset, is identified as 10. The IQR is then calculated by finding the median of the lower half (which is 5, the average of 4 and 6) and the median of the upper half (which is 13, the average of 12 and 14). The IQR is the difference between these two medians, resulting in a value of 8. The process is demonstrated step by step, encouraging learners to practice the method before the instructor provides the solution.
🎼 Interquartile Range of Songs on Albums in a Collection
The second paragraph focuses on calculating the IQR of a different dataset, this time representing the number of songs on each album in Shane's collection. The data is initially presented in a dot plot but is then reordered into a list: 7, 9, 9, 10, 10, 10, 11, 12, 12, and 14. With an even number of data points, the median is found by averaging the two middle numbers, which are both 10, resulting in a median of 10 for the dataset. The first half of the data (7, 9, 9, 10) has a median of 9, and the second half (10, 11, 12, 12, 14) has a median of 12. The IQR is calculated by subtracting the median of the first half from that of the second half, yielding a result of 3. The explanation emphasizes the methodical approach to finding the IQR, which is a measure of the dataset's spread or dispersion.
Mindmap
Keywords
💡Interquartile Range (IQR)
💡Quartiles
💡Median
💡Sorting Data
💡Dataset
💡Spread
💡Odd and Even Number of Observations
💡Data Points
💡Measure of Dispersion
💡Khan Academy
💡Dot Plot
Highlights
Practice exercise on calculating interquartile ranges from Khan Academy.
Sorting data from least to greatest is the first step in finding the interquartile range.
The median is the middle number in a sorted, odd-numbered dataset.
For an even-numbered dataset, the median is the average of the two middle numbers.
Interquartile range measures the spread of the middle 50% of the data.
The first quartile (Q1) is the median of the first half of the data, excluding the median of the entire dataset.
The third quartile (Q3) is the median of the second half of the data.
Interquartile range is calculated as the difference between Q3 and Q1.
The example dataset of animal crackers had an interquartile range of 8.
In a dot plot, data can be represented differently but still needs to be sorted for calculation.
When the dataset is even, the median is the average of the two central numbers.
The dataset of albums in Shane's collection has a median of 10.
For the first half of an even-numbered dataset, the median can be included in either half.
The interquartile range of Shane's album song dataset is 3.
The method demonstrated is applicable to datasets with both even and odd numbers of data points.
The instructor encourages active participation by suggesting the audience attempt the exercise before viewing the solution.
The calculation of the interquartile range provides insight into the dataset's variability.
The process of calculating the interquartile range is demonstrated step-by-step for clarity.
Transcripts
Browse More Related Video
Finding the Median | Math with Mr. J
Another example constructing box plot | Data and statistics | 6th grade | Khan Academy
How To Find The Interquartile Range & any Outliers - Descriptive Statistics
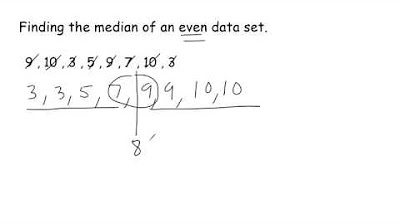
How To Find The Median Of A Data Set
How to Find the Median | Math with Mr. J

How do we Find the Median? | Don't Memorise
5.0 / 5 (0 votes)
Thanks for rating: