Business Calculus - Math 1329 - Section 1.3 - Lines and Linear Functions
TLDRThe video script delves into the concept of lines and linear functions, focusing on slope as a rate of change. It explains the calculation of slope using the formula ΔY/ΔX and illustrates how slope remains constant across a line. The script then applies the concept to a business scenario, calculating the cost function for a publisher with given costs for different quantities of books. It demonstrates how to find the slope of the cost function, interpret it, and use it to determine costs for additional books. The video also covers the slope-intercept form and point-slope form of linear equations, showing how to derive the cost function equation from given points. It concludes with a break-even analysis comparing two different printing cost functions, determining the break-even point and which function is more cost-effective based on the number of books published.
Takeaways
- 📈 **Slope as Rate of Change**: The concept of slope is introduced as a rate of change, which is the quantity of one unit divided by another, such as miles per hour.
- 🔢 **Slope Formula**: The formula for calculating slope (m) is the change in y (Δy) divided by the change in x (Δx), expressed as m = (y2 - y1) / (x2 - x1).
- 📐 **Slope Constancy**: The slope of a line is constant, meaning it remains the same between any two points on the line.
- 📚 **Publishing Cost Function**: An example is given where the cost of printing books is linear, and the slope represents the cost per additional book.
- 💵 **Cost Interpretation**: The slope's unit (e.g., dollars per book) provides insight into the cost structure of the function, such as each additional book costing six dollars to publish.
- 📊 **Linear Equations for Business Applications**: Linear equations are used to determine costs and other business-related information, like the cost of publishing a certain number of books.
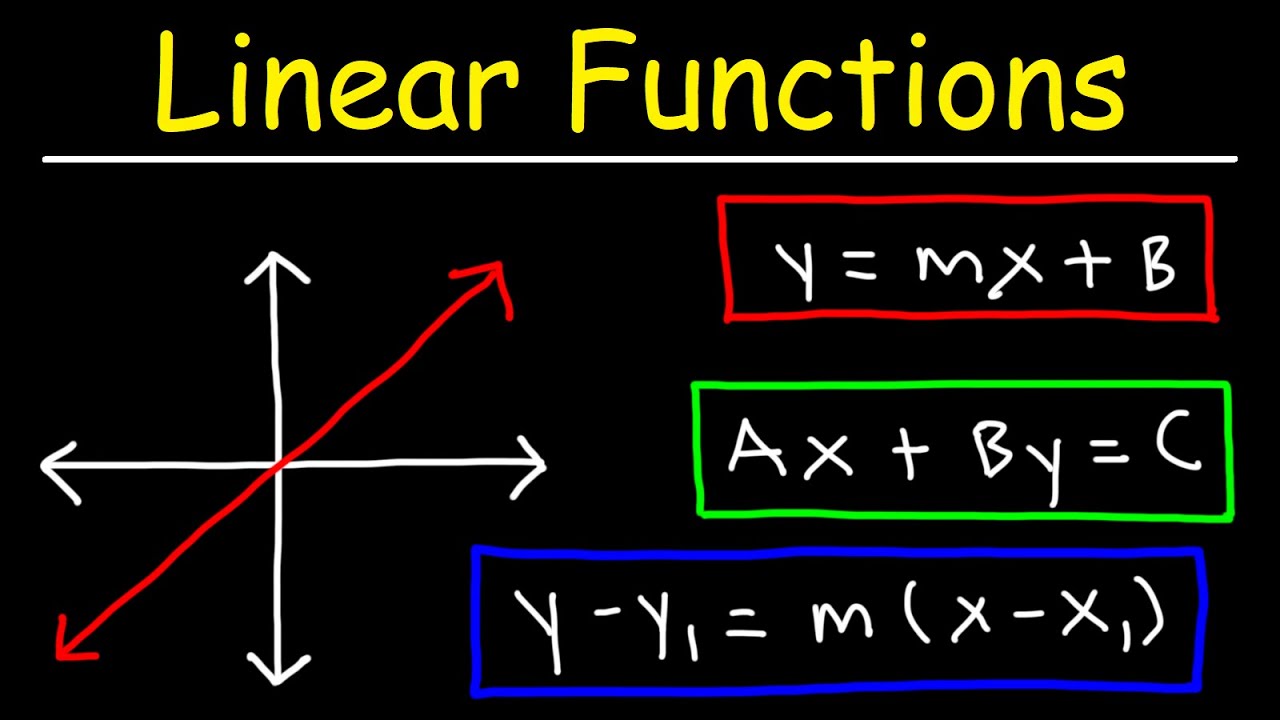
- 🧮 **Slope-Intercept Form**: The general form for a linear equation is y = mx + b, where m is the slope and b is the y-intercept.
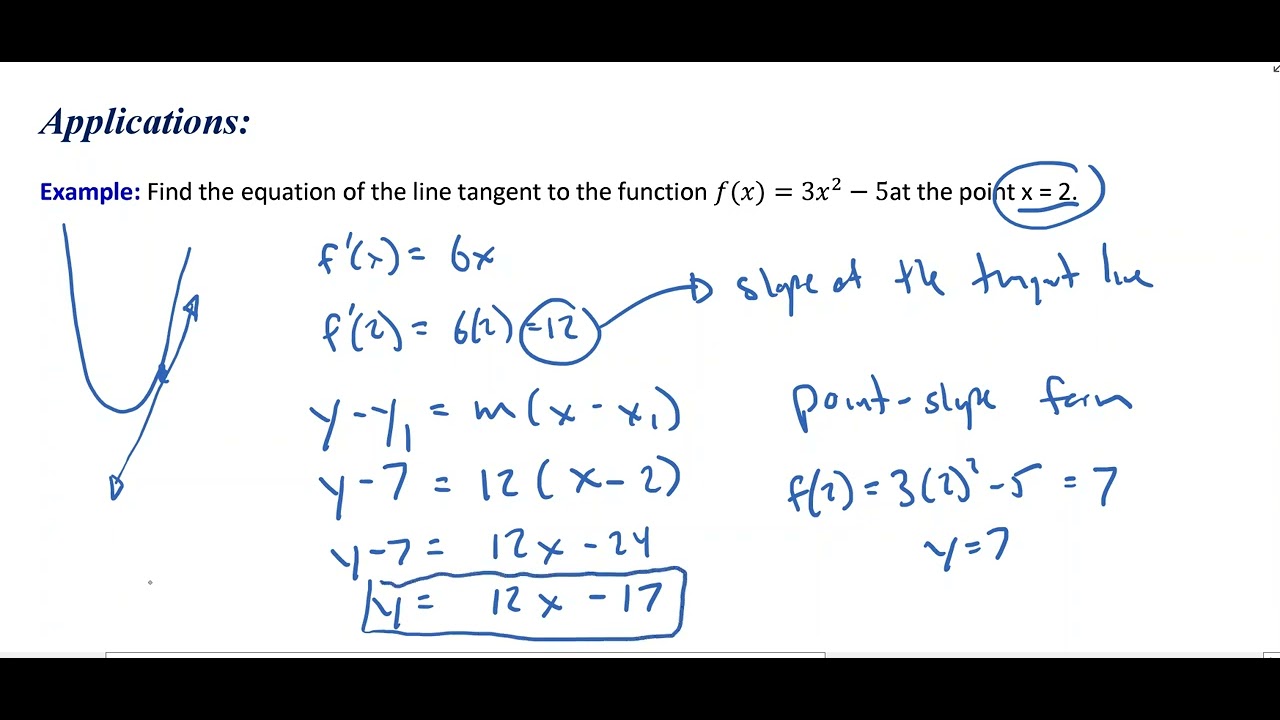
- 🔗 **Point-Slope Form**: Another form of linear equation is y - y0 = m(x - x0), which is useful for finding the equation of a line given a point and the slope.
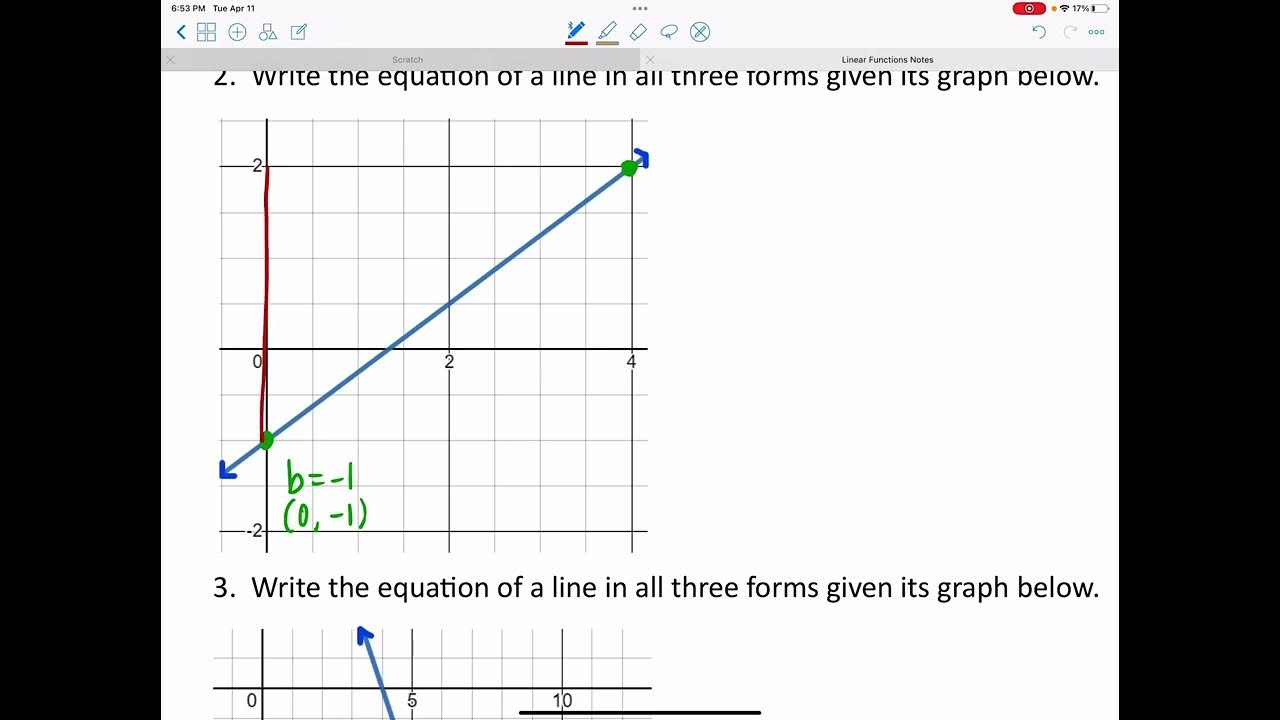
- 📈 **Graphing Cost Functions**: The cost function can be graphed with the y-intercept and slope to visualize cost changes with the number of books published.
- ✅ **Break-Even Analysis**: A method to determine the point at which two different cost functions yield the same cost, helping to decide which process is more cost-effective.
- 🔄 **Comparing Cost Functions**: By comparing the slopes and y-intercepts of two linear functions, one can determine the cost efficiency of different printing methods at various quantities of books.
Q & A
What is the concept of slope in the context of linear functions?
-Slope is considered as a rate of change, which can be thought of as a quantity expressed as one unit divided by another unit, such as miles per hour in the case of speed.
What is the formula for calculating the slope of a line that passes through two points (x1, y1) and (x2, y2)?
-The formula for slope (M) is given by M = ΔY / ΔX, which translates to (y2 - y1) / (x2 - x1), where Δ signifies change.
Why is the order of subtraction important when calculating slope?
-The order of subtraction is crucial because it ensures that the first point's coordinates (y1, x1) are subtracted from the second point's coordinates (y2, x2), maintaining the correct order to avoid an incorrect result.
How does the slope of a line relate to the ratio of change between two points on the line?
-The slope is the constant ratio of the change in Y to the change in X (ΔY/ΔX) between any two points on the line, regardless of the size of the triangle formed by these points and the axes.
What does the slope of a publishing cost function represent?
-The slope of the publishing cost function represents the additional cost per book. For example, a slope of $6 indicates that it costs $6 to publish each additional book.
How is the slope-intercept form of a linear equation represented?
-The slope-intercept form of a linear equation is represented as y = mx + b, where 'm' stands for the slope and 'b' is the y-intercept.
What is the point-slope form of a linear equation, and how is it derived?
-The point-slope form is represented as y - y0 = m(x - x0), where 'm' is the slope and (x0, y0) is a point on the line. It is derived using a point on the line and the slope of the line.
How can you determine the cost of publishing a certain number of books using a linear cost function?
-You can determine the cost by plugging the number of books into the linear cost function in the form of C = mx + b, where 'C' is the total cost, 'm' is the cost per book (slope), 'x' is the number of books, and 'b' is the fixed cost.
What is a break-even analysis, and how is it used to compare two different cost functions?
-A break-even analysis is used to determine the point at which two different cost functions yield the same cost. It is done by setting the two cost functions equal to each other and solving for the number of units (in this case, books) that makes the costs equal.
How does the break-even point help in deciding which cost function is better for a specific number of books?
-The break-even point indicates the number of books at which the costs of the two functions are equal. If fewer books are published than the break-even point, the function with the lower cost is preferable. Conversely, if more books are published, the function with the lower cost per book beyond the break-even point is preferable.
What are the key differences between two cost functions with different slopes and y-intercepts?
-The key differences include the fixed cost (y-intercept) and the cost per book (slope). A higher y-intercept indicates a higher fixed cost, while a higher slope indicates a higher cost per book. These differences affect the total cost and the decision-making process for choosing a cost function based on the number of books to be published.
Outlines
📈 Introduction to Linear Functions and Slope
This paragraph introduces the concept of lines and linear functions, focusing on slope as a rate of change. It explains slope in terms of a quantity divided by another, using the example of speed in miles per hour. The formula for calculating slope is provided: M = ΔY/ΔX, which is the change in Y's divided by the change in X's. The text emphasizes the importance of maintaining the order of points (x1, y1) and (x2, y2) for accurate calculation. It also discusses the constancy of slope along a line and applies the concept to a business scenario involving the cost of printing books.
📊 Calculating and Interpreting Slope in a Publishing Cost Function
The paragraph delves into an example of calculating the slope of a publishing cost function, which is assumed to be linear. It provides the formula for slope and applies it to find the cost per book, which is six dollars. The example demonstrates how to use a known point and the slope to calculate the cost for additional books. It also illustrates how to use the slope to determine the cost for a specific number of books, such as 121 or 122 books, by adding the product of the slope and the additional books to the base cost.
📉 Deriving the Publishing Cost Function in Different Forms
This section covers how to find the equation of the publishing cost function using the slope-intercept form (y = mx + b) and the point-slope form (y - y₀ = m(x - x₀)). It uses the given points and the previously calculated slope to derive the cost function C(x) = 6x + 40. The paragraph also explains how to simplify the point-slope form to the slope-intercept form and emphasizes the utility of the point-slope form for quickly identifying the slope and a point on the line.
📝 Graphing the Publishing Cost Function and Determining Costs
The paragraph explains how to graph the publishing cost function using the derived equation and known points. It provides a step-by-step guide to plotting the function and marking the representative point for a specific number of books on the graph. Additionally, it shows how to use the cost function to determine the cost of publishing a different number of books, such as 140 books, by substituting the value into the equation.
🔍 Comparing Two Different Printing Cost Functions
This section discusses the differences between two cost functions, C(x) = 6x + 40 and C₂(x) = 3.5x + 260. It highlights the initial costs (fixed costs) and the additional cost per book (slope) for each function. The paragraph then introduces a break-even analysis to determine the point at which the costs of the two functions are equal, which is found to be at 88 books. It concludes by advising that the choice between the two printing methods depends on the number of books to be published: the first method is better for fewer than 88 books, and the second method is better for more than 88 books.
Mindmap
Keywords
💡Slope
💡Linear Function
💡Rate of Change
💡Slope-Intercept Form
💡Point-Slope Form
💡Publishing Cost Function
💡Break-Even Analysis
💡Fixed Cost
💡Variable Cost
💡Graph of a Function
💡Units and Dimensions
Highlights
Section 1.3 focuses on lines and linear functions, specifically the concept of slope as a rate of change.
Slope is introduced as a quantity expressed as one unit divided by another, such as speed in miles per hour.
The formula for calculating slope is presented as the change in Y divided by the change in X (ΔY/ΔX).
The importance of maintaining the order of points (x1, y1 and x2, y2) when calculating slope is emphasized.
The slope is demonstrated to be constant along a line, regardless of the chosen points.
An example is used to illustrate how to find the slope of a publishing cost function, assuming it's linear.
The slope of the publishing cost function is interpreted as the cost to publish each additional book.
The cost for publishing 121 and 122 books is determined using the slope of the cost function.
The slope-intercept form (y = mx + b) and point-slope form (y - y0 = m(x - x0)) of a linear equation are explained.
The publishing cost function is graphed using the slope-intercept form, showing the y-intercept and key points.
The cost of publishing 140 books is calculated using the publishing cost function.
A method to determine how many books can be published for a fixed budget is demonstrated.
A comparison between two different cost functions is conducted, highlighting the differences in fixed costs and variable costs per book.
A break-even analysis is performed to determine the point at which two cost functions yield the same cost.
A graphical representation is used to visualize the break-even point and to decide which cost function is preferable based on the number of books.
The conclusion that the choice of printing method depends on the number of books to be published is reached.
The break-even point of 88 books is identified as the number at which both printing methods cost the same.
The video concludes with a summary of the findings and a thank you to the viewers.
Transcripts


5.0 / 5 (0 votes)
Thanks for rating: