Ex: Determine a Linear Demand Function
TLDRThe script outlines a method to determine a linear demand function for a baseball team's stadium, given two scenarios with different ticket prices and attendance numbers. It explains the process of finding the slope of the demand curve using the point-slope form, and then deriving the demand function D(Q) with Q as the number of spectators. The final step involves simplifying the equation to a slope-intercept form, providing a clear and concise mathematical model for understanding the relationship between ticket price and attendance.
Takeaways
- 🏟️ The stadium has a capacity of 66,000 spectators.
- 🎟️ The initial ticket price was $9.00, with an average attendance of 28,000 spectators.
- 📉 When the ticket price was reduced to $6.00, the average attendance increased to 33,000 spectators.
- 📚 The demand function D(Q) is assumed to be linear, where Q represents the number of spectators.
- 📈 The slope-intercept form of the demand function is D(Q) = MxQ + B, with M being the slope and B the intercept.
- 🔍 To find the slope, calculate the change in price (ΔP) divided by the change in quantity (ΔQ), resulting in a slope of -3/5,000.
- 📌 The ordered pairs for the demand function are (28,000, 9) and (33,000, 6), with Q as the first coordinate and P as the second.
- 📐 Using the point-slope form of the line, the equation is derived as D(Q) - 9 = (-3/5,000)(Q - 28,000).
- 🔢 Simplifying the equation by adding 9 to both sides gives D(Q) = (-3/5,000)Q + 16.8.
- 📝 Converting 16.8 to a fraction with a common denominator results in D(Q) = (-3/5,000)Q + 129/5.
- 📉 The final demand function in slope-intercept form is D(Q) = -3/5,000Q + 129/5, which represents the relationship between ticket price and attendance.
Q & A
What is the maximum capacity of the stadium mentioned in the script?
-The maximum capacity of the stadium is 66,000 spectators.
What was the initial ticket price and the average attendance before the price change?
-The initial ticket price was $9.00, and the average attendance was 28,000 spectators.
What was the ticket price after it dropped, and how did the average attendance change?
-The ticket price dropped to $6.00, and the average attendance rose to 33,000 spectators.
What type of function is assumed for D of Q in the script?
-It is assumed that D of Q is a linear function.
What is the general form of a linear function in the context of the script?
-The general form of a linear function is D of Q = M * Q + B, where M is the slope and B is the y-intercept.
How are the ordered pairs represented in the context of the demand function?
-The ordered pairs are represented as (Q, P), where Q is the number of spectators and P is the price.
What is the slope of the demand function calculated in the script?
-The slope of the demand function is calculated to be -3/5000.
How is the slope calculated using the two given points in the script?
-The slope is calculated as the change in price (6 - 9) divided by the change in attendance (33,000 - 28,000).
What is the point-slope form of the demand function equation used in the script?
-The point-slope form used is D of Q - P1 = slope * (Q - Q1), where P1 and Q1 are the price and quantity from one of the given points.
What is the final form of the demand function after solving for D of Q in the script?
-The final form of the demand function is D of Q = (-3/5000) * Q + 129/5.
What mathematical operation is suggested to simplify the demand function further in the script?
-The script suggests distributing the slope fraction and combining like terms to simplify the demand function.
Outlines
📉 Price Elasticity of Stadium Attendance
The script discusses the relationship between ticket prices and stadium attendance for a baseball team. It presents a scenario where a stadium with a capacity of 66,000 has an average attendance of 28,000 when tickets are priced at $9. When the ticket price is reduced to $6, attendance increases to 33,000. The goal is to find a linear demand function D(Q), where Q is the number of spectators. The script explains the process of determining the slope of the demand curve using the change in price and attendance, resulting in a slope of -3/5000. It then uses the point-slope form of a line to derive the demand function, adjusting for the correct order of coordinates where Q is the first element of the pair. The script concludes with a step-by-step guide to solving for D(Q), including algebraic manipulation to express the function in slope-intercept form, resulting in D(Q) = (-3/5000)Q + 129/5.
Mindmap
Keywords
💡Baseball Team
💡Stadium
💡Spectators
💡Ticket Price
💡Average Attendance
💡Demand Function
💡Linear
💡Slope
💡Point-Slope Form
💡Quantity (Q)
💡Price (P)
Highlights
A baseball team plays in a stadium with a capacity of 66,000 spectators.
The initial ticket price is $9.00, with an average attendance of 28,000 spectators.
When the ticket price is reduced to $6.00, average attendance increases to 33,000 spectators.
The demand function D(Q) is to be found, where Q represents the number of spectators.
The demand function D(Q) is assumed to be linear.
The equation of D(Q) is sought in the slope-intercept form, Y = MX + B.
The function is expressed as D(Q) = M x Q + B, with M as the slope and B as the intercept.
Two data points are given: (28,000, $9.00) and (33,000, $6.00), with Q as the first coordinate and P as the second.
The slope of the demand function is calculated using the change in price and change in attendance.
The slope is determined to be -3 divided by 5,000.
The point-slope form of the line is used to find the demand function D(Q).
The equation is manipulated to solve for D(Q), starting with adding 9 to both sides.
The demand function is expressed in a form that includes the slope and intercept.
Further steps involve distributing the fraction and combining like terms.
The final demand function is simplified to D(Q) = (-3/5000)Q + 129/5.
The process demonstrates how to derive a linear demand function from given data points.
The transcript provides a step-by-step guide to finding the demand function using algebraic methods.
Transcripts
Browse More Related Video
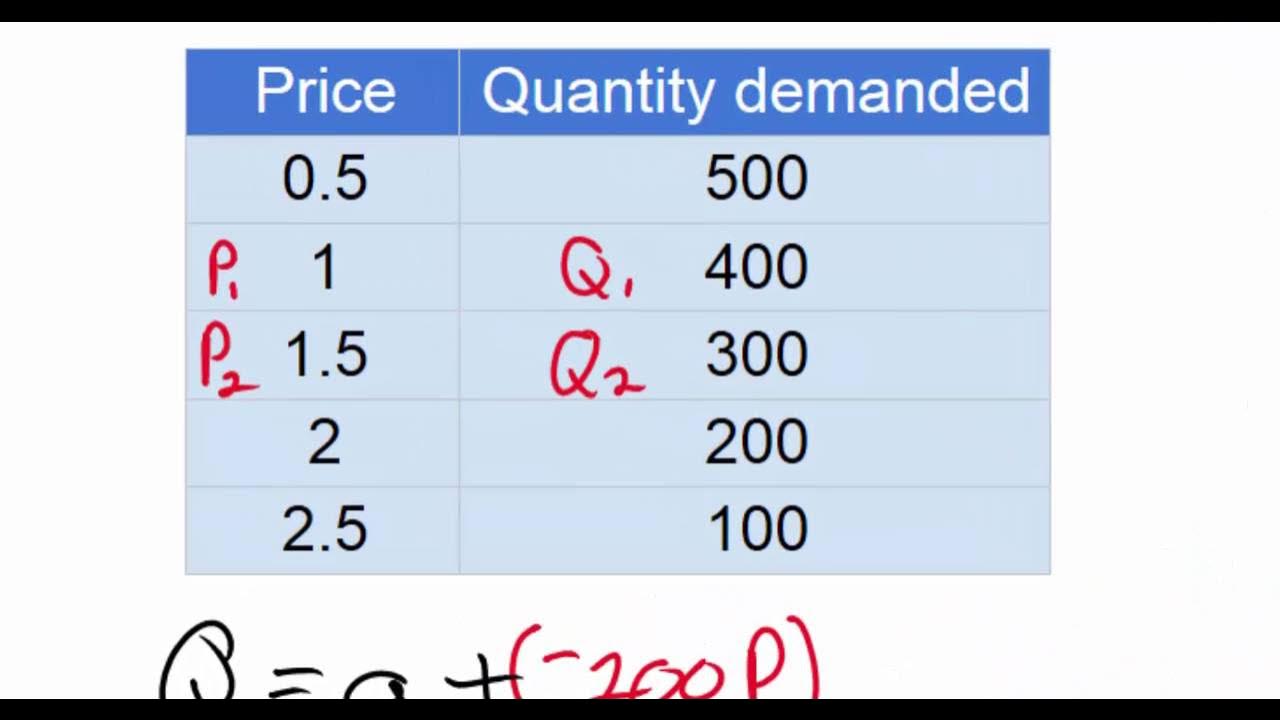
Linear Demand Equations - part 1(NEW 2016)
Business Calculus - Math 1329 - Section 1.3 - Lines and Linear Functions
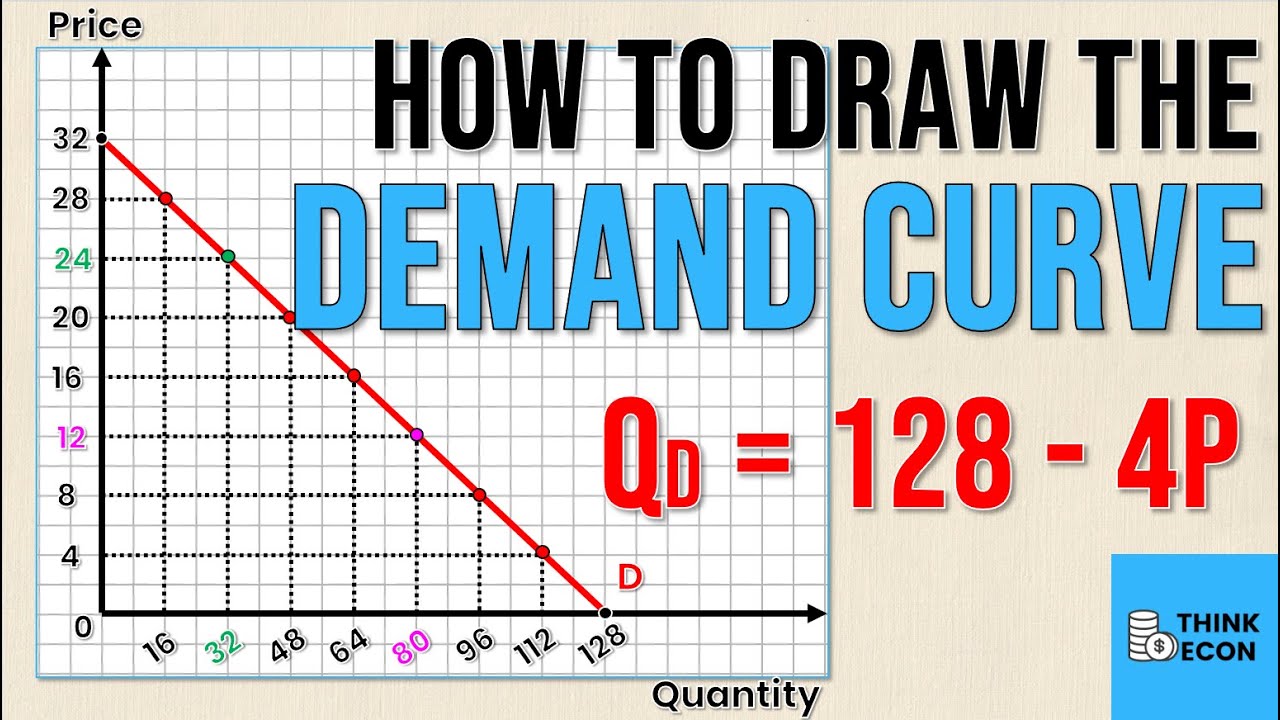
How to Draw the DEMAND CURVE (Using the DEMAND EQUATION) | Think Econ
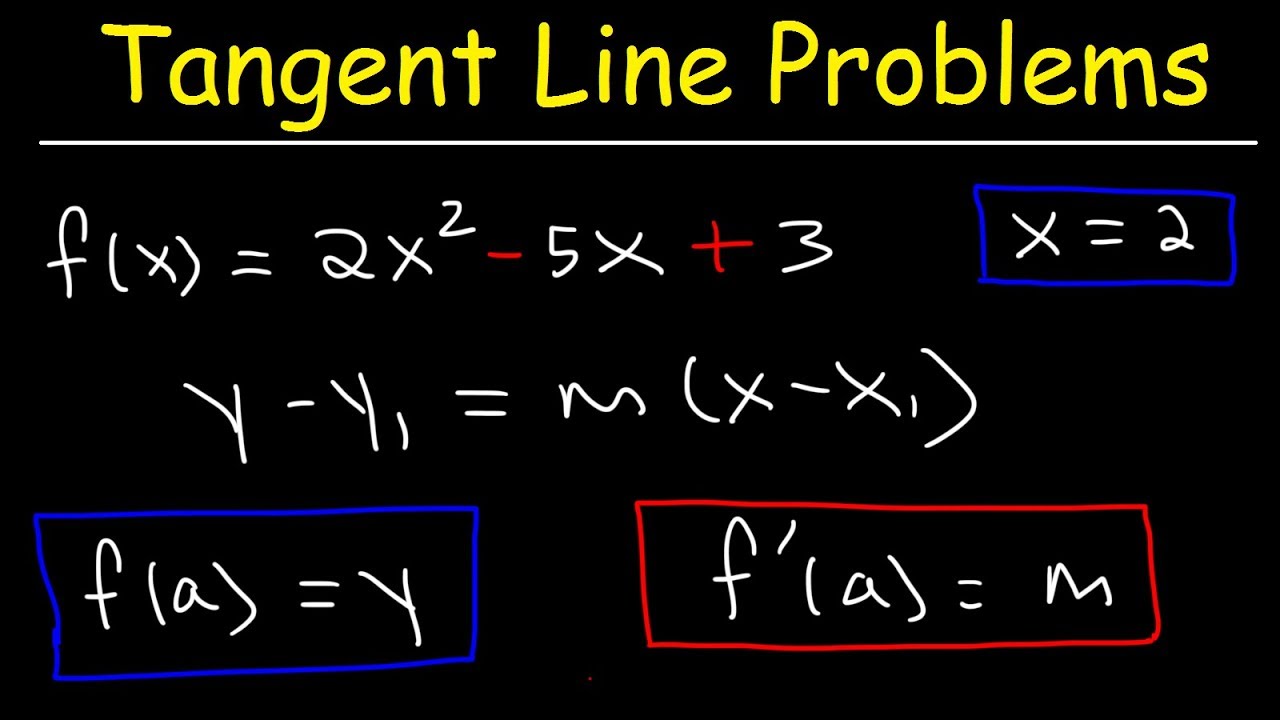
How To Find The Equation of The Tangent Line With Derivatives
How To Find The Equation of the Normal Line
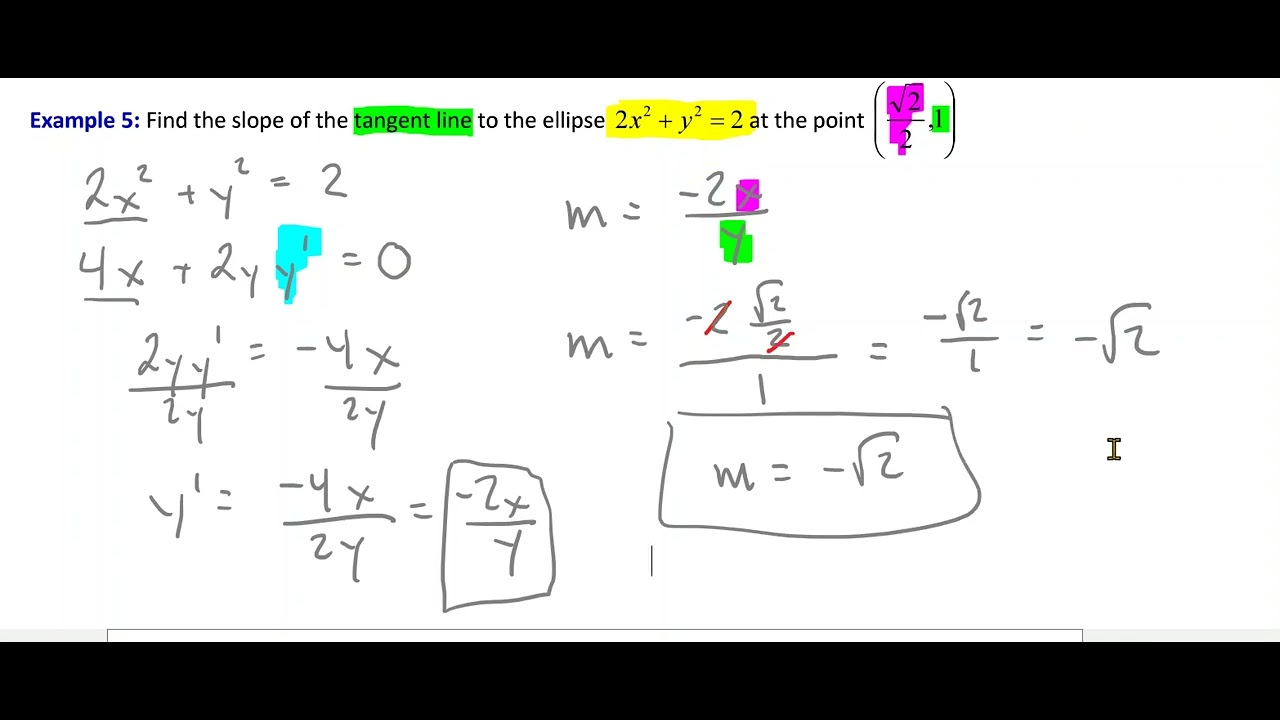
Implicit Differentiation - Finding Equation of Tangent Line
5.0 / 5 (0 votes)
Thanks for rating: