How to Graph with Transformations (Precalculus - College Algebra 15)
TLDRThe video script is an in-depth guide on graphing transformations, focusing on understanding basic graph shapes, identifying key points, and applying various transformations such as shifts, compressions, and reflections. The instructor uses the function f(x) = -1/2 |x - 3| + 2 as a primary example to demonstrate how to analyze and graph the function by identifying the basic shape (a V-shape), key points (1, 1; 0, 0; -1, 1), and the transformations (up 2 units, right 3 units, vertical compression by 1/2, and reflection about the x-axis). The script emphasizes the importance of understanding these elements to accurately sketch graphs and provides techniques for doing so, including finding y-intercepts and using axis symmetry for even functions.
Takeaways
- 📈 Understanding transformations is crucial for graphing functions, as it helps to predict how the graph will change based on mathematical operations.
- 🔍 Identifying the basic graph shape is the first step in graphing transformations, as it sets the foundation for understanding how the function will behave.
- 📊 Key points of the basic graph shape are essential to recognize, as they serve as the reference for applying transformations.
- ➡️ Horizontal and vertical shifts affect the input and output values differently, with horizontal shifts corresponding to movements along the x-axis and vertical shifts affecting the y-axis.
- 🔢 Multiplication and division outside the function affect the output values, causing compression or expansion of the graph's height.
- 🔄 Reflections about the x-axis or y-axis change the direction in which the graph faces, without altering the input values.
- ⚖️ Even and odd functions have distinct symmetry properties, which can be used to predict and plot the graph more efficiently.
- 📍 Finding the y-intercept by plugging in x equals zero can provide a point on the graph, improving its accuracy.
- 🔑 Recognizing and applying the order of operations (parentheses, exponents, multiplication and division, addition and subtraction) is vital for accurately graphing transformations.
- 🔄 Understanding that a negative sign inside a function can lead to reflections and changes in the sign of the output is key to plotting the graph correctly.
- ✅ Practicing graphing transformations by applying them step-by-step helps solidify the understanding of how different transformations affect the graph.
Q & A
What is the basic graph shape for the function f(x) = -1/2 |x - 3| + 2?
-The basic graph shape for the given function is a V-shape, which is derived from the absolute value expression |x - 3|.
What are the key points of the basic graph shape for an even function?
-The key points for an even function, which is symmetric about the y-axis, are typically (1, 1), (0, 0), and (-1, 1), reflecting the even nature of the function.
How does the transformation 'plus two' affect the graph of the function?
-The 'plus two' transformation affects the graph by shifting it vertically upward by two units, as it is an addition that occurs after the absolute value operation.
What is the effect of the transformation 'subtract 3' on the graph of the function?
-The 'subtract 3' transformation affects the graph by shifting it horizontally to the right by three units, as it is a subtraction that occurs before the absolute value operation.
How does multiplying the output by one half impact the graph?
-Multiplying the output by one half results in a vertical compression of the graph by a factor of 1/2, making the graph appear 'thinner' or more compressed vertically.
What is the effect of multiplying the output by a negative value on the graph?
-Multiplying the output by a negative value reflects the graph about the x-axis, changing the sign of all the output values and thus inverting the graph vertically.
What is the process of identifying transformations and graphing the function f(x) = -1/2 |x - 3| + 2?
-The process involves identifying the basic graph shape (V-shape), determining the key points, recognizing the transformations (vertical shift up by 2, horizontal shift right by 3, vertical compression by 1/2, and reflection about the x-axis), and then applying these transformations to the key points to graph the function.
How can one find the y-intercept of the graph?
-To find the y-intercept, substitute x = 0 into the function and solve for the output value. For the given function, f(0) = -1/2 |0 - 3| + 2, which simplifies to -1/2 * 3 + 2, resulting in a y-intercept of 1/2.
What is the significance of the axis of symmetry in graphing even functions?
-The axis of symmetry is significant as it runs through the point where the function changes from increasing to decreasing. Utilizing the axis of symmetry can help graph the function more accurately with minimal work, as it provides a reference for the symmetrical behavior of the function.
Why is it important to understand the order of transformations when graphing a function?
-Understanding the order of transformations is crucial because it determines how the graph is affected step by step. For instance, a vertical shift (up or down) affects the output, a horizontal shift (left or right) affects the input, and multiplication or reflection transformations also affect the output in different ways.
How does the technique of shifting the axes help in graphing?
-Shifting the axes helps in graphing by providing a new reference frame that reflects the transformations applied to the function. This technique allows for plotting the new key points on the shifted axes, which simplifies the process of drawing the graph accurately.
Outlines
📈 Understanding Graph Transformations Basics
The paragraph introduces the concept of graph transformations, emphasizing the importance of understanding basic graph shapes, identifying key points, and recognizing the types of transformations applied to functions. It outlines a systematic approach to graphing transformations, which includes labeling transformations, shifting the x and y-axis to create a new coordinate system, and modifying key points accordingly. The paragraph also mentions considering axes of symmetry and improving the accuracy of the graphed function.
🔍 Deep Dive into Function Transformations
This paragraph takes a detailed look at the function f(x) = -1/2 |x - 3| + 2, breaking down the various transformations applied to it. It explains how to identify the basic graph shape (a V-shape due to the absolute value), locate key points, and understand the impact of each transformation such as vertical shift up by two units, horizontal shift to the right by three units, vertical compression by a factor of 1/2, and a reflection about the x-axis. The process of graphing is further illustrated by adjusting the key points based on these transformations.
🎯 Accurate Graphing with Transformations
The paragraph focuses on the technique of graphing functions with transformations by first identifying the basic shape of the graph, then determining key points and the specific transformations applied. It discusses the order in which transformations are applied and how to visualize the new key points after shifting the axes. The explanation includes finding the y-intercept and using axis symmetry to enhance the graph's accuracy. The importance of understanding the impact of each transformation on the graph is highlighted.
🤔 Reflecting on Odd Functions and Transformations
This section discusses the process of graphing functions that are odd, such as cubic functions. It explains how to identify key points, which for odd functions are typically (1,1), (0,0), and (-1,-1). The paragraph then describes how to apply transformations like vertical and horizontal shifts, vertical compression, and reflections to adjust the graph accordingly. It also emphasizes the importance of understanding how these transformations affect the output values of the function.
📚 Adjusting Functions to Recognizable Forms
The paragraph addresses the need to adjust functions to a form that makes it easier to identify transformations. It suggests rewriting functions to resemble known basic shapes, such as reciprocal functions, and ensuring that the function has a positive x term first. The focus is on making the function easier to interpret in terms of transformations, which simplifies the graphing process.
🤓 Mastering Reciprocal Function Transformations
This segment delves into the specifics of graphing reciprocal functions, which are odd and have key points at (1,1) and (-1,-1). It outlines the process of identifying and applying transformations such as vertical shifts, horizontal shifts, and vertical stretches. The paragraph also covers how to find the y-intercept and use key points to plot the transformed function accurately.
🧐 Tackling Square Root Functions with Transformations
The final paragraph deals with graphing square root functions and the transformations applied to them. It discusses the importance of having the function's x term positive and first to accurately interpret transformations. The paragraph explains how to handle shifts, reflections, and stretches, and how to find key points after applying these transformations. It also demonstrates how to use these points to sketch the graph of the transformed function.
📘 Summarizing Transformations for Graphing
The concluding paragraph emphasizes the importance of understanding how transformations affect a graph, which is crucial for graphing in various mathematical contexts, including calculus and trigonometry. It summarizes the key points about transformations, such as vertical shifts, horizontal shifts, reflections, and stretches or compressions, and how they change the graph of a function. The paragraph encourages a deep understanding of these concepts rather than relying on trial-and-error methods for graphing.
Mindmap
Keywords
💡Transformations
💡Absolute Value
💡Key Points
💡Vertical Shift
💡Horizontal Shift
💡Compression
💡Reflection
💡Axis of Symmetry
💡Y-Intercept
💡Cubic Function
💡Reciprocal Function
Highlights
The importance of understanding transformations for graphing functions is emphasized.
The basic graph shape of a function should be identified before applying transformations.
Key points of the basic graph shape are crucial for determining how transformations affect the graph.
Labeling all transformations helps in systematically altering the graph.
Shifting the x and y-axis creates a new coordinate system to plot transformed key points.
Multiplicative transformations affect the output values of a function.
Additive transformations, such as a plus or minus inside a function, affect the input values.
A vertical shift up is indicated by adding a constant after the absolute value function.
A horizontal shift is represented by subtracting a constant from the input within the function.
Vertical compression is achieved by multiplying the output by a fraction, making the graph narrower.
Reflection about the x-axis is indicated by multiplying the output by a negative value.
Identifying the axis of symmetry can simplify the graphing process for even functions.
The technique of shifting the axes and plotting new key points is a practical approach to graphing transformations.
Finding the y-intercept by plugging in x equals zero can improve the accuracy of the graph.
The process of graphing transformations involves a combination of vertical and horizontal shifts, compressions, and reflections.
Understanding the order of operations in functions is vital for correctly applying transformations.
The video provides a step-by-step approach to graphing the function f(x) = -1/2 |x - 3| + 2.
Practicing graphing transformations on various functions helps solidify the understanding of function behavior.
The video concludes with encouragement to practice graphing different types of functions to master the skill.
Transcripts
Browse More Related Video
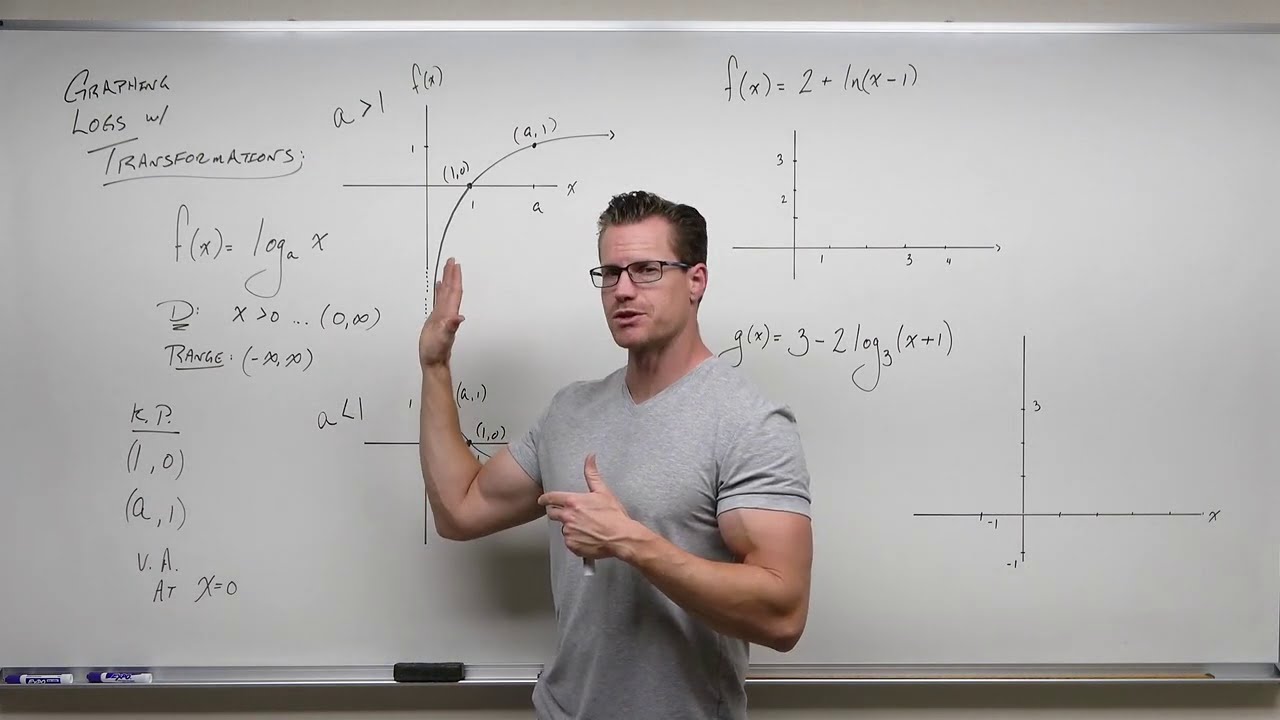
Graphing Logarithms with Transformations (Precalculus - College Algebra 56)
Graphing Quadratic Functions Using Transformations
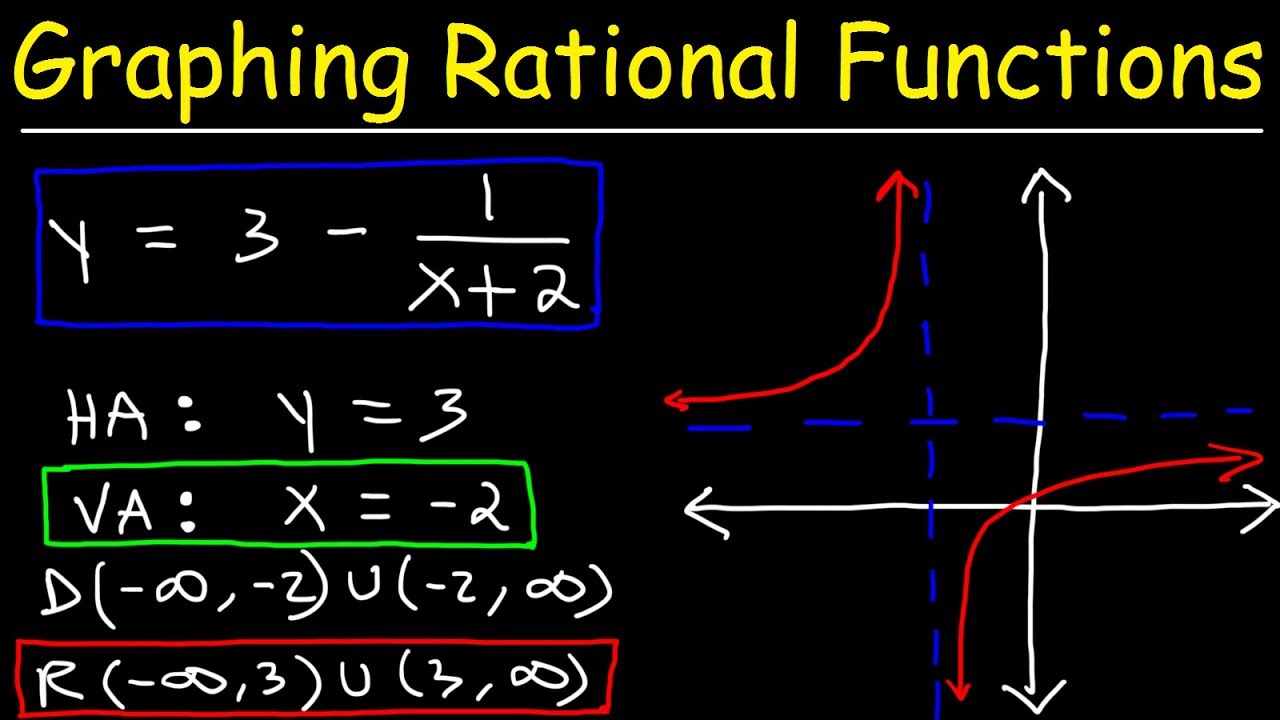
Graphing Rational Functions Using Transformations With Vertical and Horizontal Asymptotes
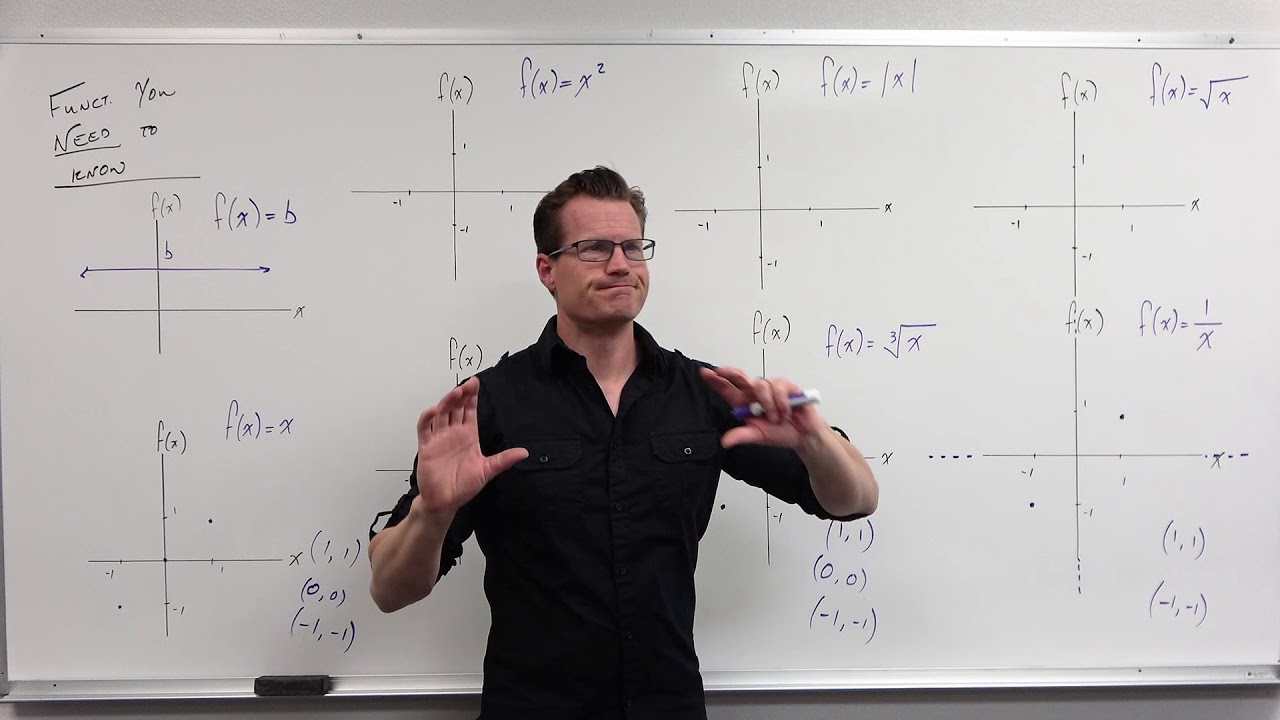
Graphs You Must Know (Precalculus - College Algebra 13)

Graphing Rational Functions with Transformations (Precalculus - College Algebra 39)
Graphing Exponential Functions with Transformations (Precalculus -College Algebra 53)
5.0 / 5 (0 votes)
Thanks for rating: