Graphing Logarithms with Transformations (Precalculus - College Algebra 56)
TLDRThe video script is an educational guide on graphing logarithms with transformations. It emphasizes understanding the inverse relationship between exponentials and logarithms, noting that while exponentials increase, logarithms decrease. The presenter outlines the basic graph shape of a logarithm, highlighting the vertical asymptote at x=0 and key points (1,0) and (base,1). The process involves identifying the logarithm, considering the base, and applying transformations such as shifts and reflections. The script provides a step-by-step approach to graphing two examples, one with a base of e (approximately 2.7) and another with a base of 3, including the effects of vertical and horizontal shifts, reflections, and vertical stretches or compressions. The summary also clarifies that logarithmic functions do not have a horizontal asymptote and continue towards positive infinity. The presenter encourages practice in applying these techniques for mastering the graphing of logarithms.
Takeaways
- 📈 **Understanding Logarithms**: Logarithms are the inverse of exponentials and always decrease, unlike exponentials which increase.
- 📉 **Domain of Logarithms**: The domain of a logarithm is all positive real numbers because the argument (x) must be positive.
- 🔑 **Key Points**: The key points for a logarithm function are (1,0) and (base,1), which are the reverse of the key points for an exponential function.
- 📊 **Asymptotes**: Logarithms have a vertical asymptote at x=0, in contrast to exponentials which have a horizontal asymptote at y=0.
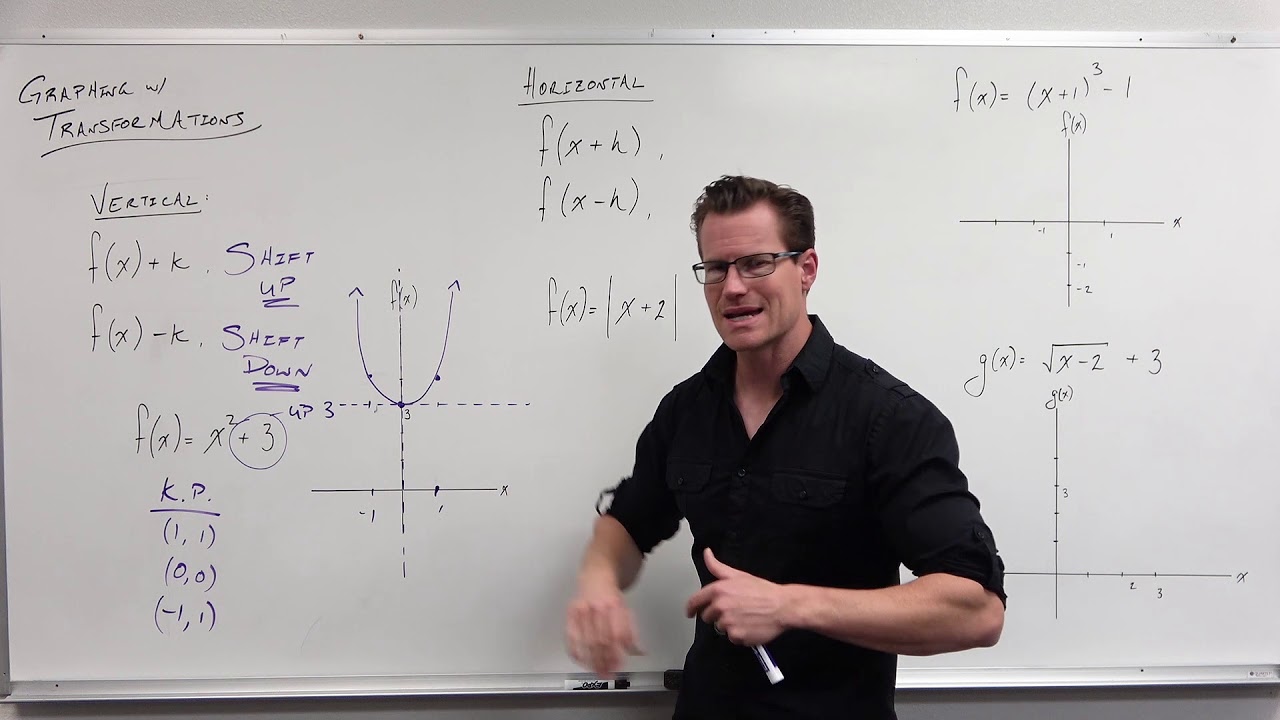
- 🔄 **Transformations**: Transformations of logarithms follow the same rules as other functions: anything inside the function affects the input (horizontal shift), and anything outside affects the output (vertical shift).
- 🔀 **Order of Operations**: When graphing logarithms, it's important to put the logarithm function first and then apply transformations in the correct order.
- 📐 **Identifying Shifts**: Identify vertical and horizontal shifts by looking at the terms inside and outside the logarithmic function, respectively.
- ↔️ **Reflection and Stretch**: A negative coefficient before the logarithm indicates a reflection, and a numerical coefficient indicates a vertical stretch or compression.
- 🧮 **Base Consideration**: The base of the logarithm affects the shape of the graph; if the base is greater than 1, the graph will have a specific increasing or decreasing pattern.
- ∞ **No Horizontal Asymptote**: Logarithmic functions do not have a horizontal asymptote because their range is all real numbers, and they approach negative infinity.
- 📌 **Plotting Key Points**: After identifying transformations, plot the key points based on the shifted graph to sketch the logarithmic function accurately.
Q & A
What is the main topic discussed in the transcript?
-The main topic discussed in the transcript is the process of graphing logarithms with transformations, including understanding their key points, asymptotes, and how to apply transformations to the graphs.
What is the relationship between exponentials and logarithms?
-Exponentials and logarithms are inverse functions of each other. While exponentials are always increasing, logarithms are always decreasing.
What are the key points for the graph of a logarithm function?
-The key points for the graph of a logarithm function are (1,0) and (the base, 1), which are the inverse of the key points for an exponential function.
What is the domain of a logarithm function before any transformations are applied?
-The domain of a logarithm function before any transformations are applied is all positive real numbers, as the logarithm is not defined for non-positive values.
What is the asymptote associated with logarithms?
-Logarithms have a vertical asymptote at x equals zero, which means the function approaches but never actually reaches this line as x approaches zero from the right.
How does the base of a logarithm affect its graph?
-If the base of the logarithm is greater than 1, the graph decreases from left to right and the key point (base, 1) is to the right of the y-axis. If the base is less than 1, the graph increases from left to right and the key point (base, 1) is to the left of the y-axis.
What is the significance of the order of terms in a logarithmic expression when graphing?
-The order of terms in a logarithmic expression is important because it determines the type of transformations applied to the graph. Terms inside the logarithm affect horizontal shifts, terms outside affect vertical shifts, and terms in front of the logarithm can cause reflections or vertical stretches/compressions.
What is the role of the coefficient in front of a logarithm in terms of graph transformations?
-The coefficient in front of a logarithm can cause a reflection (if it's negative) and a vertical stretch or compression (depending on the absolute value of the coefficient). It affects the outputs of the logarithm after the inputs have been processed through the logarithm.
How do you determine the new key points after applying horizontal and vertical shifts to a logarithmic graph?
-After applying horizontal and vertical shifts, you determine the new key points by plotting the original key points (1,0) and (base, 1) in relation to the new origin created by the shifts. The vertical asymptote also shifts accordingly.
Why do logarithmic functions not have a horizontal asymptote?
-Logarithmic functions do not have a horizontal asymptote because their range is all real numbers. They can increase or decrease without bound, approaching positive or negative infinity, rather than leveling off at a constant value.
What is a common mistake made when graphing logarithms and how can it be avoided?
-A common mistake is assuming that a logarithmic function has a horizontal asymptote, similar to exponential functions. This can be avoided by remembering that logarithms only have a vertical asymptote at x=0 and their range is all real numbers, so they do not level off at a finite value.
Outlines
📈 Understanding Logarithms and Their Graphs
This paragraph introduces the concept of graphing logarithms. It emphasizes the importance of understanding that logarithms are the inverse of exponentials, which means that while exponentials increase, logarithms decrease. The domain of a logarithm is all positive real numbers, and the key points for a logarithm graph are (1,0) and the point corresponding to the base 'a', which is (a,1). The paragraph also explains that logarithms have a vertical asymptote at x=0. The process of graphing logarithms involves identifying the base, key points, and applying transformations such as shifts and reflections to plot the graph accurately.
🚀 Applying Transformations to Logarithms
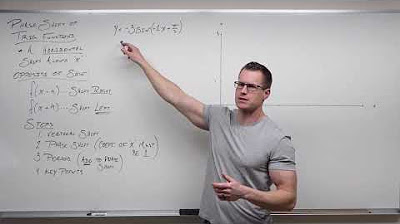
The second paragraph delves into the specifics of applying transformations to logarithms. It discusses the order of operations and how to interpret different parts of a logarithmic function for transformation purposes. The paragraph explains that anything within the function represents a horizontal shift, anything after the function a vertical shift, and anything in front of the function a reflection or vertical stretch/compression. Using the natural logarithm as an example (base e, approximated to 2.7), the paragraph demonstrates how to identify key points, apply shifts, and adjust for reflections or stretches to graph the logarithm function.
🤔 Dealing with Vertical Stretch and Asymptotes
The third paragraph focuses on the effects of a negative coefficient on the outputs of a logarithmic function, which results in a vertical stretch. It clarifies that logarithms do not have a horizontal asymptote, as their range is all real numbers, and they continue to negative infinity. The paragraph also illustrates how to calculate the new key points when there's a vertical stretch involved and emphasizes the importance of plotting these points correctly. It advises on how to improve the graph by plugging in values to find their logarithms and to ensure the graph accurately reflects the mathematical transformations.
📚 Summarizing the Graphing Process and Upcoming Topics
The final paragraph summarizes the process of graphing logarithms by reiterating the steps of putting expressions in order, identifying the logarithm, considering transformations, and plotting key points. It also previews upcoming topics, which include solving exponential and logarithmic equations. The paragraph encourages practice and assures that the techniques taught are applicable to more advanced graphing in college algebra and precalculus trigonometry.
Mindmap
Keywords
💡Logarithms
💡Transformations
💡Domain
💡Asymptotes
💡Key Points
💡Base of Logarithm
💡Vertical Shift
💡Horizontal Shift
💡Reflection
💡Vertical Stretch or Compression
💡Graph Sketching
Highlights
The transcript focuses on graphing logarithms with transformations, emphasizing the understanding of logarithms as the inverse of exponentials.
Logarithms always have a domain of positive numbers and a vertical asymptote at x equals zero.
Key points for logarithms are one, zero, and the base comma one, which are derived from the properties of exponentials.
The base of the logarithm determines if the graph will increase or decrease, with a base greater than one resulting in a graph to the right of one.
The process of graphing logarithms involves identifying the function, its order, and applying transformations such as shifts and reflections.
For transformations, anything within the function represents a horizontal shift, after the function is a vertical shift, and in front of the function indicates a reflection or vertical stretch/compression.
The base 'e' is commonly approximated as 2.7 for the purpose of graphing logarithms.
When shifting logarithms, the vertical asymptote and key points are shifted accordingly, treating the shift as a new origin.
The transcript demonstrates how to graph logarithms with a base of 'e', including identifying key points and applying vertical and horizontal shifts.
For logarithms with a base greater than one, the graph will initially resemble an exponential graph before applying any transformations.
The negative coefficient in front of a logarithm reflects the graph across the x-axis and stretches it vertically.
Logarithms do not have a horizontal asymptote; their range is all real numbers, and they continue to negative infinity.
The transcript illustrates the graphing of a logarithm with a base of 3, including the effects of a negative coefficient and vertical shift.
When graphing, it's important to plot key points after applying transformations and to ensure the graph reflects these changes accurately.
The technique of transformation is a valuable tool that can be applied to a wide range of functions, including those in precalculus and trigonometry.
The transcript emphasizes the importance of practice in graphing logarithms to solidify the understanding of transformations and their effects on the graph.
The process of graphing logarithms involves a systematic approach: identifying the logarithm, considering the base, identifying key points, applying shifts and transformations, and plotting the graph.
Transcripts
Browse More Related Video
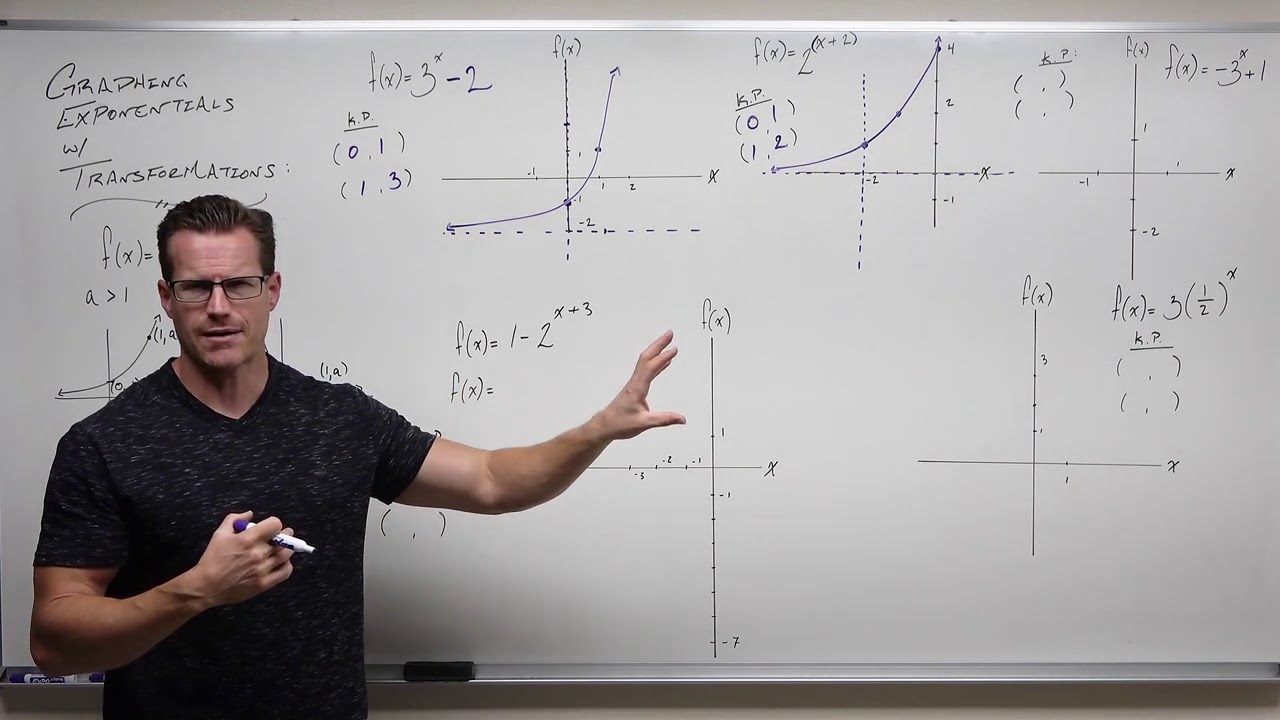
Graphing Exponential Functions with Transformations (Precalculus -College Algebra 53)
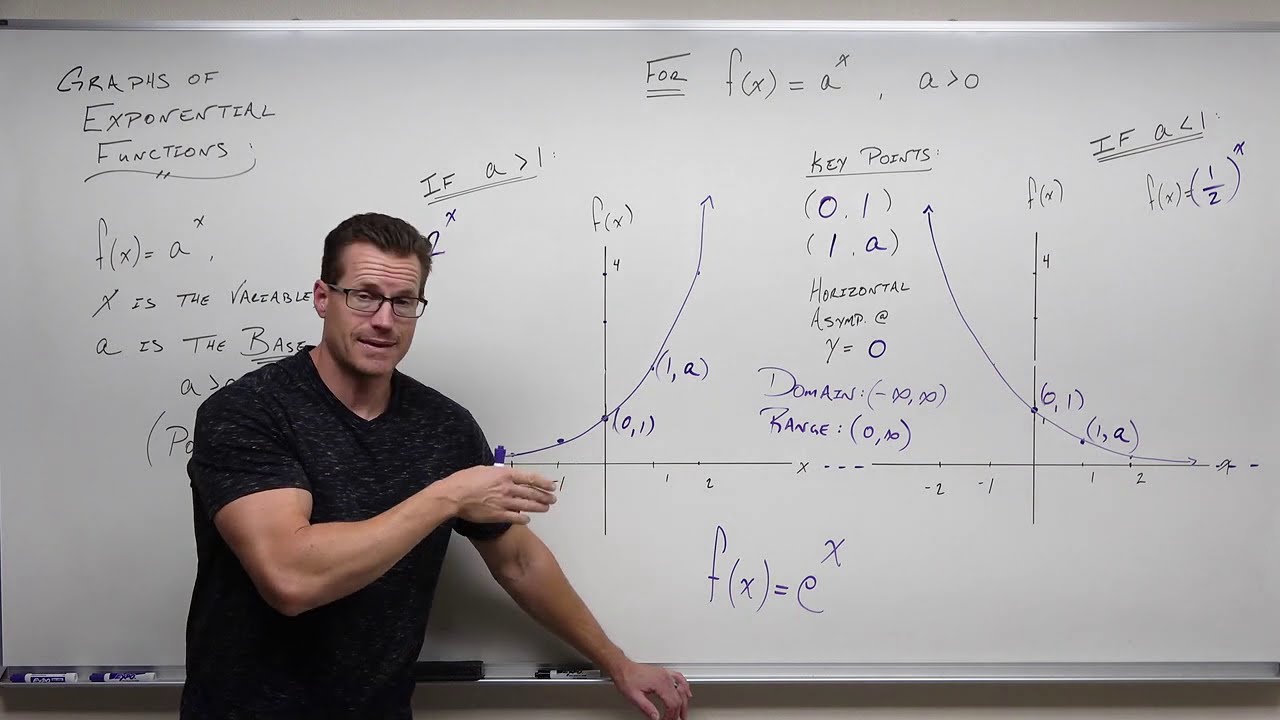
Graphs of Exponential Functions (Precalculus - College Algebra 52)
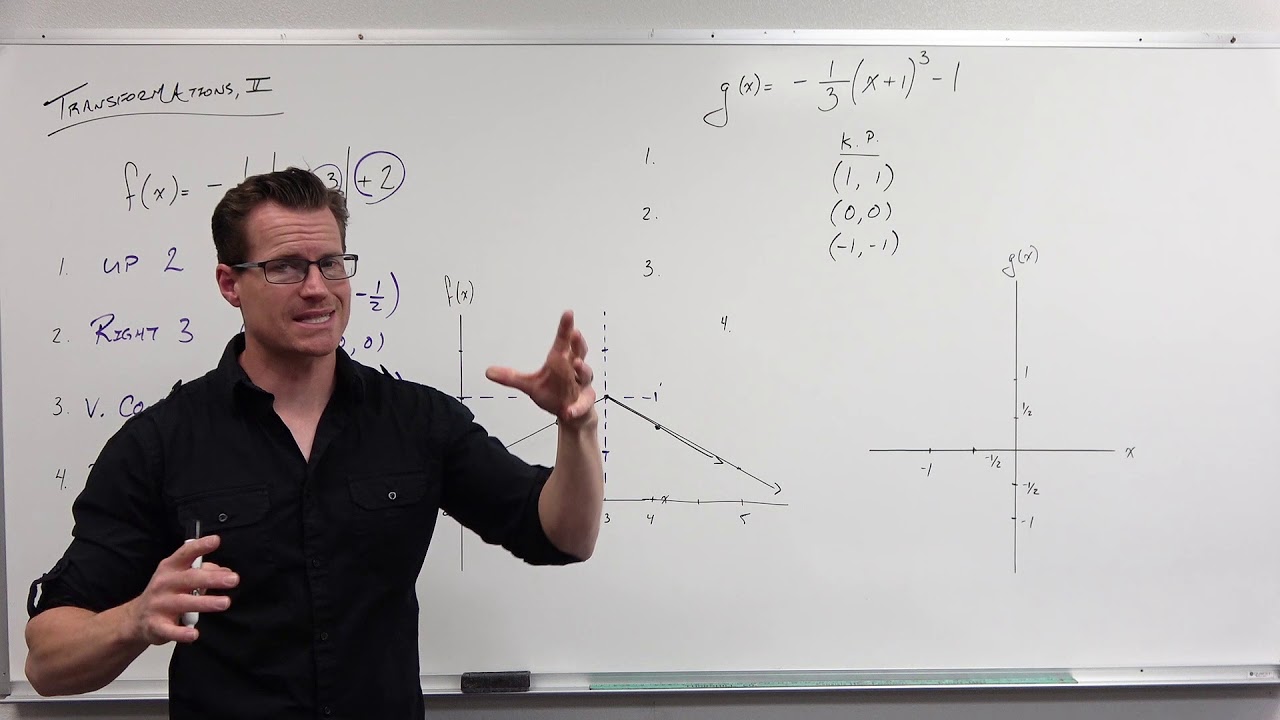
How to Graph with Transformations (Precalculus - College Algebra 15)
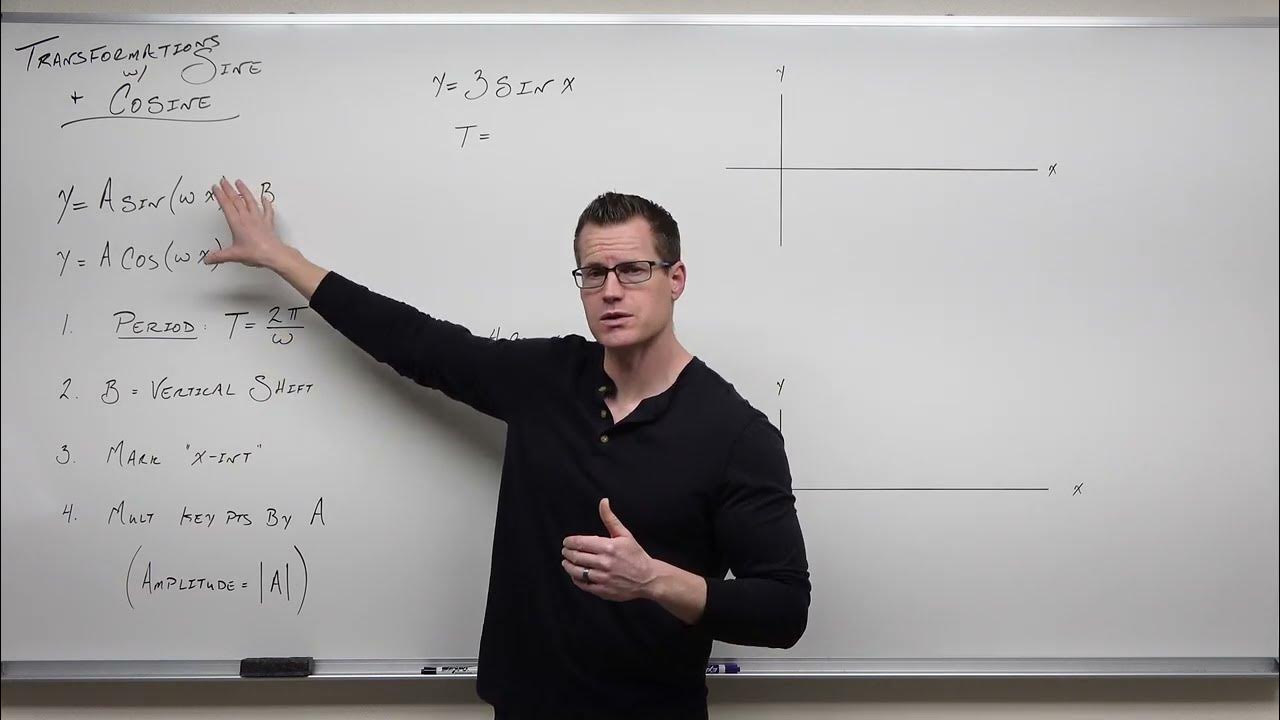
Graphing Transformations with Sine and Cosine (Precalculus - Trigonometry 12)
Introduction to Graph Transformations (Precalculus - College Algebra 14)
How to Graph Phase Shifts of Trigonometric Functions (Precalculus - Trigonometry 16)
5.0 / 5 (0 votes)
Thanks for rating: