Linear regression using R programming
TLDRThis video delves into the fundamentals of linear models, specifically focusing on simple linear regression. It explains the relationship between two numeric variables, using the example of car speed and stopping distance. The video covers key concepts such as hypothesis testing, the significance of the slope, predicting y-values, and interpreting the y-intercept. It emphasizes the importance of understanding residuals, p-values, and R-squared to evaluate the model's fit and predictive power. The practical application is demonstrated using R programming, showcasing how to create, interpret, and use a linear model for prediction.
Takeaways
- 📊 Linear models, specifically simple linear regression, is a fundamental statistical method for understanding relationships between two numeric variables.
- 🔍 The purpose of a linear model is to test the existence of a relationship (positive or negative), explain variation, and make predictions based on the relationship between variables.
- 🛣️ In the example provided, the independent variable is the speed of a car, and the dependent variable is the distance it takes for the car to stop, with a positive relationship observed.
- 🎯 The model aims to answer whether there is a real slope, how much variation is explained by the model, and predict the value of y for a given x.
- 📈 The linear model is represented by a line, with the y-intercept and slope being the key components needed to draw this line.
- 🔢 The y-intercept, although calculated, can sometimes be meaningless, such as predicting the stopping distance of a stopped car (speed = 0).
- 🎲 Hypothesis testing with a p-value helps determine if the observed slope is statistically significant, allowing us to reject or accept the null hypothesis.
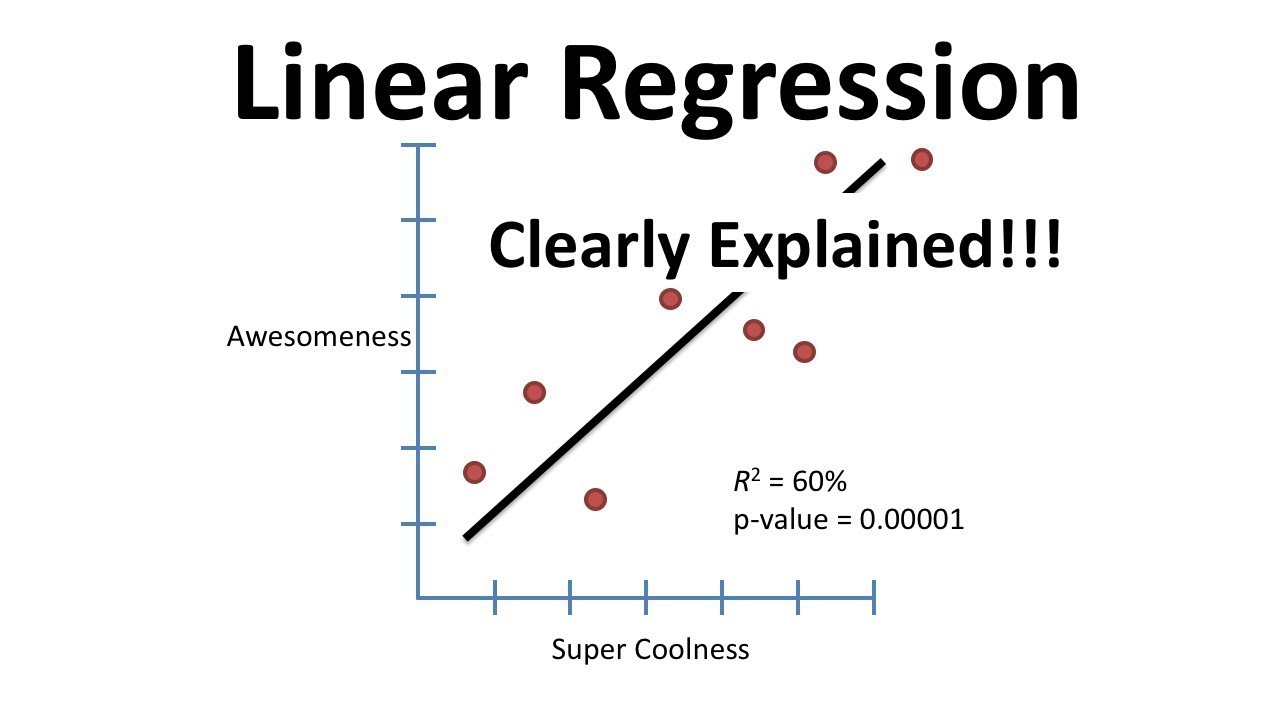
- 📉 The r-squared value indicates the proportion of the y variable's variation that is predictable from the x variable, with a higher value signifying a better fit.
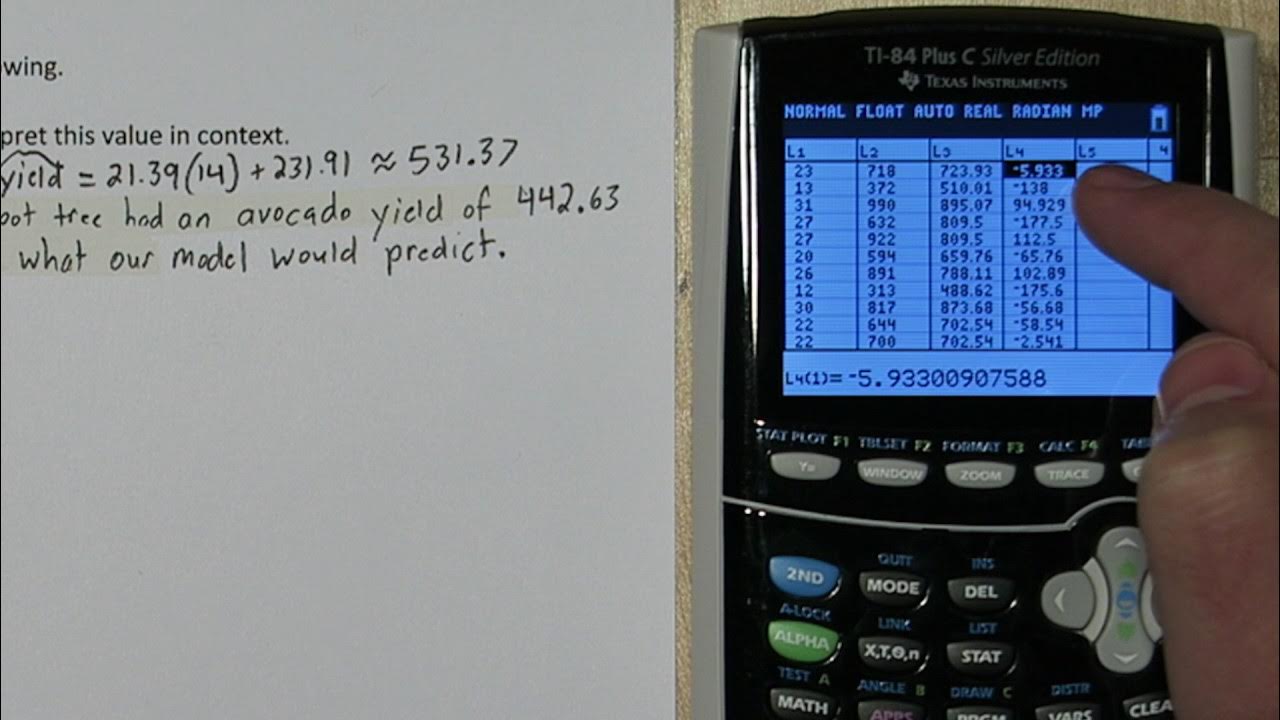
- 📊 Residuals are the differences between the observed values and the values predicted by the model, with a good fit having minimal residuals.
- 🔄 The video script also demonstrates the practical application of linear modeling in R, showing how to create a model, interpret its output, and use it for prediction.
- 🚗 The example dataset 'cars' is used to illustrate the creation and interpretation of a simple linear model in R, showing how to predict stopping distances based on different speeds.
Q & A
What is the main topic of the video?
-The main topic of the video is linear models or linear regression, specifically focusing on understanding and interpreting a simple linear model.
Why is understanding a simple linear model important?
-Understanding a simple linear model is important because it forms the basis for understanding more complex modeling techniques. Grasping the essentials of a simple linear model makes it much easier to build upon that knowledge for more advanced statistical analyses.
What are the two numeric variables used in the example in the video?
-The two numeric variables used in the example are the speed of a car and the distance it takes for the car to stop.
What does the independent variable represent in the context of the video?
-In the context of the video, the independent variable (represented on the x-axis) represents the speed of the car. It is the variable that is presumed to cause changes in the dependent variable when it changes.
What is the dependent variable in the example?
-The dependent variable in the example is the distance the car takes to stop (represented on the y-axis). It is the outcome variable that is expected to change in response to changes in the independent variable (car speed).
What is the null hypothesis in the context of the linear model discussed in the video?
-The null hypothesis in the context of the linear model discussed is that there is no upward or downward relationship between the speed of the car and the distance it takes to stop. In other words, the slope of the line is zero, indicating no effect of speed on stopping distance.
What does the slope of the line in a linear model represent?
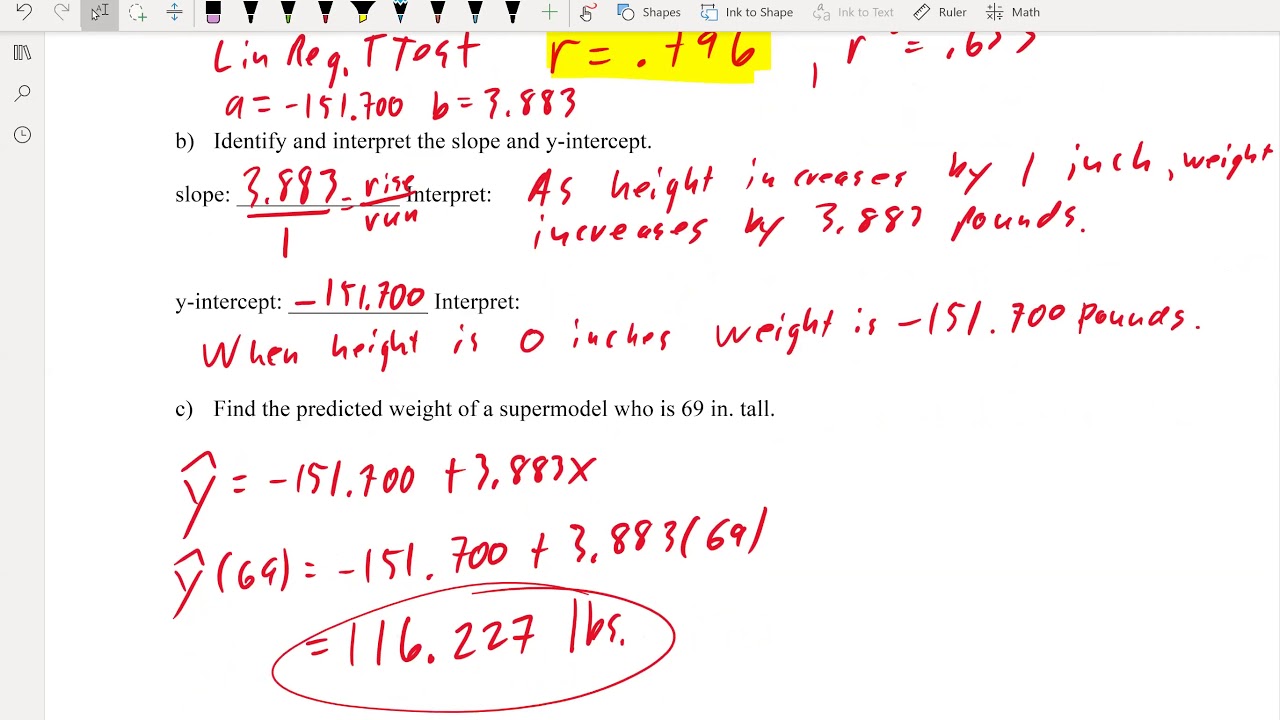
-The slope of the line in a linear model represents the change in the dependent variable (y-axis) for every one-unit change in the independent variable (x-axis). In the video example, a slope of 3.9 means for every increase of one mile per hour in speed, the car will require an additional three feet of distance to stop.
What is the y-intercept in the context of the linear model, and is it always meaningful?
-The y-intercept in the context of the linear model is the point where the line crosses the y-axis. It represents the value of the dependent variable when the independent variable is zero. However, it is not always meaningful, as in the case of the video example where a stopped car (zero speed) does not have a meaningful stopping distance (y-intercept of -17).
What is the p-value in hypothesis testing, and what does a small p-value indicate?
-The p-value in hypothesis testing is the probability of obtaining the observed results (or more extreme) if the null hypothesis were true. A small p-value (such as 4.9 x 10^-12 mentioned in the video) indicates that the observed results are very unlikely under the null hypothesis, leading to the rejection of the null hypothesis in favor of the alternative hypothesis that there is a real relationship between the variables.
What does R-squared (r^2) represent in a linear model?
-R-squared (r^2) in a linear model represents the proportion of the variation in the dependent variable that can be explained by the independent variable. A value of 0.65, as mentioned in the video, indicates that 65% of the variation in the stopping distance can be explained by changes in the car's speed.
How can you use a linear model to make predictions?
-You can use a linear model to make predictions by plugging in values for the independent variable into the model equation (y = intercept + slope * x). The model will then give you the predicted value for the dependent variable based on the input x-value.
What is the purpose of residuals in a linear model, and what do you look for in their distribution?
-Residuals in a linear model represent the difference between the observed values and the values predicted by the model. Ideally, a good model fit would have residuals that are symmetrically distributed around zero, indicating that the model accurately captures the relationship between the variables.
Outlines
📊 Introduction to Linear Models
This paragraph introduces the concept of linear models, specifically focusing on simple linear regression. It emphasizes the importance of understanding the basics of a simple linear model as a foundation for grasping more complex modeling techniques. The discussion includes the purpose of a model, which is to test the relationship between variables, measure the variation explained by the model, and make predictions. The example used is the relationship between a car's speed and the distance it takes to stop, highlighting the intuitive understanding that faster cars require a longer stopping distance. The paragraph sets the stage for further exploration of linear modeling and its applications in statistical analysis.
🔍 Interpreting Linear Model Results
This paragraph delves into the interpretation of results from a linear model. It discusses key outputs such as the y-intercept, slope, p-value, and R-squared. The y-intercept, while often meaningless in practical terms, is necessary for model formulation. The slope indicates the relationship between the independent and dependent variables, with the example showing a slope of 3.9, meaning for every increase of one mile per hour, the stopping distance increases by three feet. The p-value, which is extremely small in this case, supports the rejection of the null hypothesis and acceptance of a statistically significant slope. Lastly, R-squared is introduced as the proportion of variation in the dependent variable that can be explained by the independent variable, with a value of 0.65 indicating that 65% of the variation in stopping distance is explained by changes in speed.
📈 Creating and Evaluating a Simple Linear Model
This paragraph explains the process of creating a simple linear model using R programming language and the 'cars' dataset. It outlines the steps to fit a linear model, interpret residuals, and evaluate the model's coefficients. The residuals are the differences between the observed values and the model's predictions, and a good fit is indicated by residuals clustered close to zero. The coefficients section revisits the y-intercept and slope, reinforcing their significance in the model. The paragraph also discusses the p-value for the slope, emphasizing its role in hypothesis testing and the model's predictive capabilities. It concludes by highlighting the importance of understanding these components to build a strong foundation in linear modeling.
🔧 Advanced Usage of Linear Model Objects
This paragraph explores advanced features of linear model objects in R, such as accessing specific components and making predictions using the model. It demonstrates how to create a model object and use it to extract residuals, which can be further analyzed through visualization techniques like histograms. The paragraph also shows how to use the model for predicting outcomes for new data points, illustrating the practical application of linear modeling in making informed predictions. The example given involves predicting stopping distances for various speeds, showcasing the model's output in a clear and understandable manner. The paragraph concludes by encouraging viewers to explore further applications of R for document generation and emphasizes the importance of sharing knowledge and continuing education.
Mindmap
Keywords
💡Linear Model
💡Independent Variable
💡Dependent Variable
💡Slope
💡Y-Intercept
💡Hypothesis Testing
💡P-Value
💡R-Squared
💡Residuals
💡Prediction
💡Data Visualization
Highlights
The discussion focuses on linear models and linear regression, specifically a simple linear model.
Understanding a simple linear model makes grasping more complex modeling techniques easier.
The video is part of a series that covers various programming concepts and data analysis techniques.
The current analysis phase of the series includes previously discussed t-tests and chi-squared tests.
A linear model is introduced with an example of car speed and stopping distance, illustrating a positive relationship.
The x-axis represents the independent variable, and the y-axis represents the dependent variable in a linear model.
The model aims to test the existence of a relationship between variables, predict outcomes, and understand the proportion of variance explained.
The slope of the model indicates the change in the y variable for every unit change in the x variable.
The y-intercept in a linear model is not always meaningful, such as in the case of car speed and stopping distance.
Hypothesis testing with a linear model involves determining if the slope is significantly different from zero.
A small p-value in hypothesis testing suggests that the observed slope is statistically significant.
The R-squared value indicates the proportion of the y variable's variation that can be explained by the x variable.
The video demonstrates how to create a simple linear model using R and the 'cars' dataset.
Residuals are used to assess the fit of the linear model, with a good fit having minimal residuals.
The video explains how to interpret the coefficients, p-values, and R-squared from a linear model's output.
Creating a model object in R allows for further analysis and prediction using the 'predict' function.
The video concludes with a brief mention of future content on using R to output documents and web pages.
Transcripts
Browse More Related Video


5.0 / 5 (0 votes)
Thanks for rating: