Regression and R-Squared (2.2)
TLDRThis video script delves into the concepts of regression and r-squared, explaining their application in analyzing the linear relationship between two quantitative variables. It introduces the regression line, which predicts changes in the dependent variable (y) based on unit increases in the independent variable (x). The script further clarifies the calculation of the regression line's equation using the slope (b1) and y-intercept (b naught), emphasizing the importance of correlation in determining these values. It also discusses the predictive power of the regression line and the interpretation of r-squared as a measure of how closely data points align with the regression line, highlighting its role in assessing the model's explanatory power.
Takeaways
- 📈 Regression analysis involves creating a line, known as the regression line, on a graph to represent the pattern of data points.
- 🔢 The regression line predicts the change in y when x increases by 1 unit, indicating either an increase or decrease in the value of y.
- 📊 Positive and negative relationships can be identified through regression; for instance, study time is positively related to GPA, while time spent on Facebook might be negatively related.
- 🎯 The formula for the regression line is y hat = b naught + (b1 * x), where y hat is the predicted value of y, b naught is the y-intercept, b1 is the slope, and x is the value of the independent variable.
- 🧮 B naught can be calculated as y-bar minus (b1 times x-bar), and b1 is calculated as r times the standard deviation of y divided by the standard deviation of x.
- 🔍 To apply regression in practice, one must gather data, plot a graph with the dependent variable on the y-axis and the independent variable on the x-axis, and calculate the mean, standard deviations, and correlation.
- 🌟 The slope of the regression line indicates how much y is expected to change when x increases by one unit, which helps in making predictions.
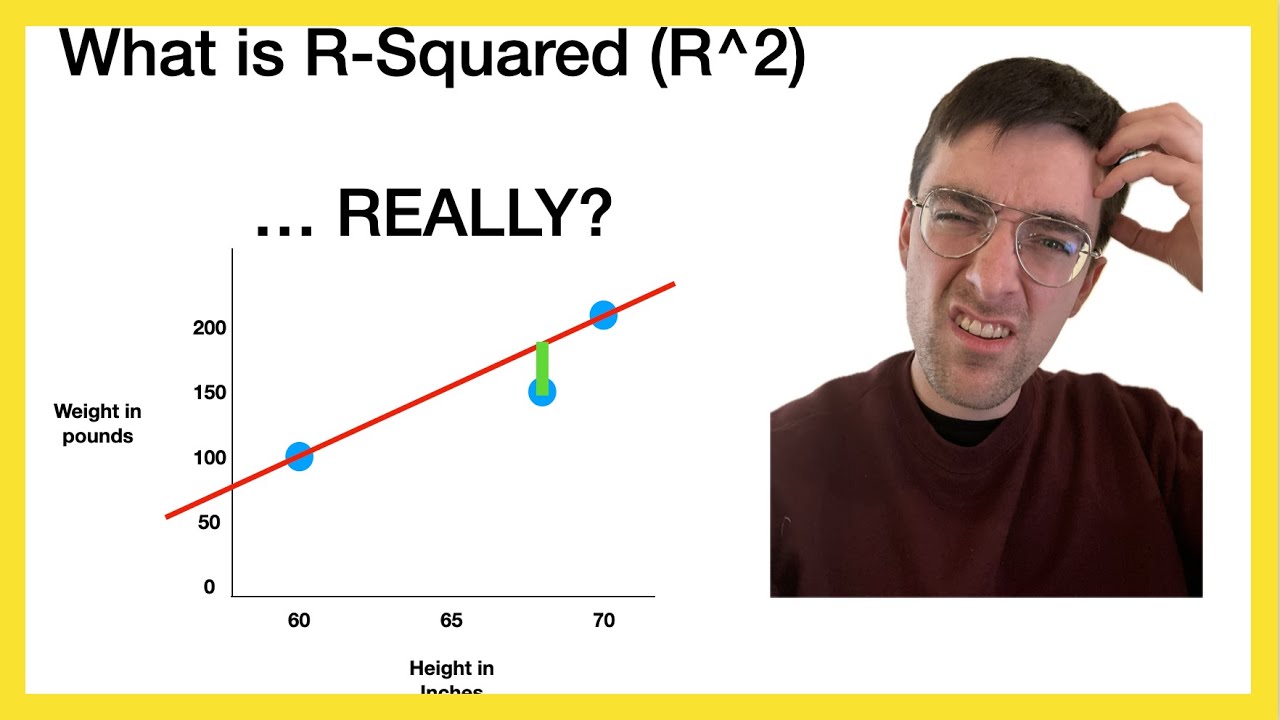
- 🏆 R-squared, or the coefficient of determination, measures how well the regression line fits the data, with values ranging from 0 to 1, where 1 indicates a perfect fit.
- 🔄 R-squared also represents the percentage of variation in the dependent variable that is explained by the independent variable in the regression.
- 📝 When r is 0.94 and r-squared is 0.88, it means that 88% of the variation in the dependent variable (GPA) is explained by its regression on the independent variable (study time).
Q & A
What is the main focus of the video?
-The video focuses on explaining regression and r-squared in the context of quantitative variables, specifically how to create and interpret a regression line on a graph.
What is a regression line?
-A regression line, also known as the line of best fit, represents the pattern of data and predicts the change in y when x increases by 1 unit. It is a straight line that summarizes the overall relationship between two variables.
How does the regression line predict changes in y based on x?
-The regression line predicts changes in y by using the slope (b1) and y-intercept (b naught) values. For every one-unit increase in x, y is expected to change by the slope value (b1).
What is the formula for the regression line?
-The formula for the regression line is y hat = b naught + b1 * x, where y hat is the predicted value of y, b naught is the y-intercept, b1 is the slope, and x is any value of the independent variable.
How is the slope (b1) of the regression line calculated?
-The slope (b1) is calculated as r times the standard deviation of y (sy) divided by the standard deviation of x (sx), where r is the correlation coefficient.
What is the role of r-squared in regression analysis?
-R-squared, or the coefficient of determination, measures how well the observed outcomes fit the regression line. It indicates the proportion of variance in the dependent variable that is predictable from the independent variable(s).
What does a high r-squared value indicate?
-A high r-squared value (close to 1) indicates that the regression line fits the data well, meaning the predicted values are close to the actual values, and the model explains a large portion of the variance in the dependent variable.
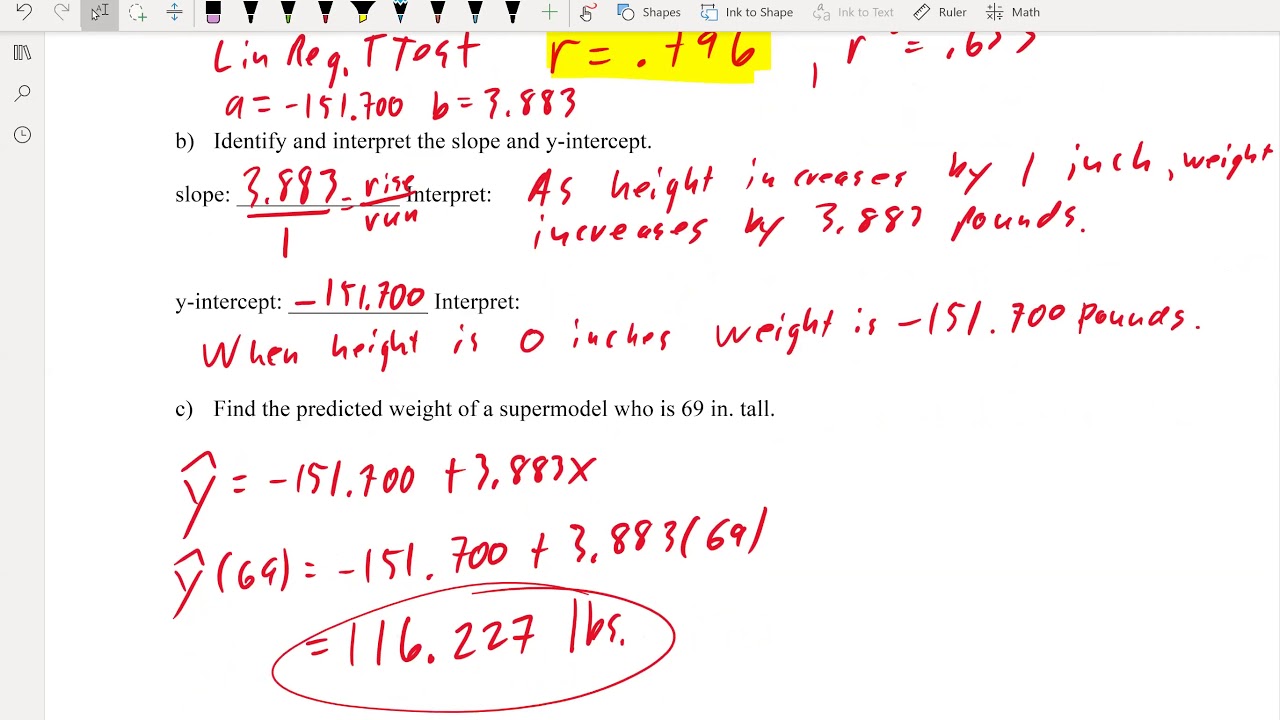
How can you use the regression equation to make predictions?
-You can use the regression equation by plugging in the value of the independent variable (x) to find the predicted value of the dependent variable (y hat). This allows you to forecast outcomes based on new data points.
What is the significance of the y-intercept (b naught) in the regression line?
-The y-intercept (b naught) represents the value of the dependent variable (y) when the independent variable (x) is zero. It is the point where the regression line crosses the y-axis on the graph.
How does the concept of correlation relate to regression analysis?
-Correlation measures the linear relationship between two quantitative variables in terms of direction and strength. It is used in regression analysis to determine the slope of the regression line and to assess how well the model fits the data.
What does it mean when r-squared is exactly equal to 1?
-When r-squared is exactly equal to 1, it indicates a perfect fit between the predicted values and the actual values. This means that the regression line can predict the value of y for any given value of x without any error.
Outlines
📈 Introduction to Regression and R-Squared
This paragraph introduces the concepts of regression and R-squared in the context of quantitative data analysis. Regression involves creating a line, known as the regression line, on a graph to represent the pattern of data points. The regression line is used to predict the change in the dependent variable (Y) when the independent variable (X) increases by one unit. The discussion includes the formula for the regression line, where Y-hat represents the predicted value of Y, B-naught is the Y-intercept, B1 is the slope, and X is the value of the independent variable. The paragraph also explains how the slope of the line indicates the direction of the relationship between the two variables, with an upward slope indicating a positive relationship and a downward slope indicating a negative relationship. The example provided uses study time and GPA to illustrate how the regression line can predict the expected change in GPA with an increase in study time. The paragraph concludes with a brief mention of how to use these formulas in practice, emphasizing the need to gather data, calculate means and standard deviations, and determine the correlation coefficient to apply the regression formula.
📊 Understanding R-Squared and its Implications
The second paragraph delves into the meaning and significance of R-squared in regression analysis. R-squared, which is the square of the correlation coefficient (R), measures how well the regression line fits the data points, indicating the proportion of variation in the dependent variable (Y) that is predictable from the independent variable (X). The paragraph explains that an R-squared value close to 1 suggests that the predicted values are in close agreement with the actual values, while a lower R-squared value indicates a poor fit of the regression line to the data. The example uses a scatter plot to visually demonstrate how R-squared reflects the closeness of data points to the regression line. The paragraph also clarifies the difference between R and R-squared, noting that R ranges from -1 to 1, representing the strength and direction of the linear relationship, whereas R-squared ranges from 0 to 1, representing the goodness of fit of the model. The explanation concludes with an example of how to interpret R-squared in the context of predicting a student's GPA based on study time, highlighting that a high R-squared value (0.88 in this case) indicates a strong predictive relationship.
Mindmap
Keywords
💡Regression
💡R-squared
💡Correlation
💡Regression Line
💡Y-intercept (b naught)
💡Slope (b1)
💡Predicted Value (y hat)
💡Standard Deviation
💡Scatter Plot
💡Least Squares Regression
💡Data Points
Highlights
Exploring regression and r-squared, key statistical concepts for understanding relationships between variables.
Regression involves creating a line, known as the regression line, on a graph to represent the pattern of data points.
The regression line predicts the change in y when x increases by 1 unit, indicating either an increase or decrease in the variable.
A positive relationship example: more study time generally leads to a better GPA.
A negative relationship example: increased time spent on Facebook could relate to a lower GPA.
The formula for the regression line is introduced, with y-hat as the predicted value of y, b naught as the y-intercept, b1 as the slope, and x as the value on the x-axis.
The y-intercept (b naught) is calculated as the mean of y minus the product of the slope (b1) and the mean of x (x-bar).
The slope (b1) is determined by multiplying the correlation coefficient (r) by the ratio of the standard deviation of y (sy) to the standard deviation of x (sx).
Practical application: predicting a student's GPA based on weekly study time by first gathering data and creating a graph with GPA on the y-axis and study time on the x-axis.
Regression analysis involves calculating the mean and standard deviations for each variable and the correlation coefficient.
The regression line equation is derived from the data, with specific values for b naught and b1, allowing for predictions of y based on x.
The concept of the line of least squares regression is introduced, which minimizes the sum of the squares of the vertical distances of the data points from the regression line.
Slope of the regression line indicates how much y changes when x increases by one unit, facilitating predictions for specific values of x.
An example demonstrates predicting a student's GPA by plugging the value of study time (6.5 hours) into the regression equation.
R-squared is explained as a measure of how well the regression line fits the data, with values ranging from 0 to 1.
A high r-squared value indicates that the predicted values are close to the actual values, while a low value suggests a poor fit.
R-squared exactly equal to 1 implies perfect prediction of y for any given x, showing the ideal fit of the regression line to the data points.
R-squared also represents the percentage of variation in y that is explained by the regression on x, providing a comprehensive understanding of the relationship's strength.
Transcripts


5.0 / 5 (0 votes)
Thanks for rating: