Graphing Sine, Cosine, Cosecant, Secant, Tangent & Cotangent (Complete Guide)
TLDRThis comprehensive video tutorial guides viewers through graphing the fundamental trigonometric functions: sine, cosine, tangent, secant, cosecant, and cotangent. It begins with basic graphs and progresses to more complex transformations, including amplitude changes, period adjustments, and phase shifts. The video also references the unit circle for graph origins and provides a clear explanation of how to calculate periods and shifts for each function. The tutorial is designed to help learners understand and apply the principles of trigonometry to graphing, with time stamps provided for easy navigation through the content.
Takeaways
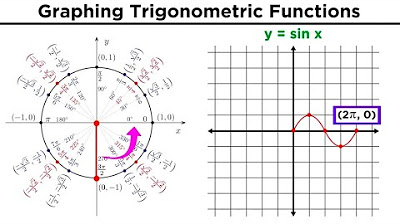
- 📈 The basic sine graph can be graphed by considering the y-coordinate of points on the unit circle at different angles.
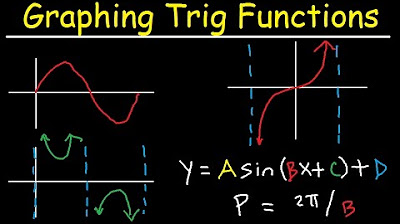
- 📊 The amplitude (a) in the function y = a * sine(X) affects the vertical stretch of the graph, with a > 1 causing an upward stretch and 0 < a < 1 causing a downward compression.
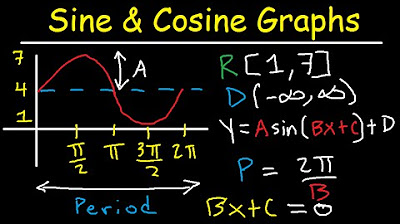
- 🔄 The period (B) in the function y = sine(B * X) changes the frequency of the sine wave; the period is given by 2π/B.
- 🔄 The phase shift in the function y = sine(X + C) affects the horizontal positioning of the graph, with a positive C shifting the graph to the left and a negative C to the right.
- 📉 The basic cosine graph starts at the maximum value, decreases to the midline, reaches the minimum, returns to the midline, and increases back to the maximum, repeating this pattern.
- 🔄 The period of the cosine function can also be altered by the coefficient B in front of X, with the new period being 2π/B.
- 🔄 The vertical shift (K) in the function y = cosine(X) + K affects the overall vertical position of the graph, with a positive K shifting the graph up and a negative K down.
- 🔄 The secant and cosecant functions are reciprocals of the cosine and sine functions, respectively, leading to different asymptotic behaviors in their graphs.
- 📈 The tangent function has a period of π and its graph includes vertical asymptotes at odd multiples of π/2, with the graph repeating every interval of π.
- 🔄 The cotangent function is the reciprocal of the tangent and has a period of π, with its graph extending from 0 to π and including vertical asymptotes at even multiples of π/2.
Q & A
What is the basic shape of the sine graph?
-The basic shape of the sine graph starts at the midline, goes up to the maximum (1), back to the midline, down to the minimum (-1), and then back to the midline, where it repeats this pattern.
How does the amplitude affect the graph of a sine function?
-The amplitude is a vertical stretch or compression of the graph. If the amplitude is greater than 1, it stretches the graph vertically, and if it is between 0 and 1, it compresses the graph vertically.
What is the period of a sine function and how is it affected by the value of 'b' in the function y = sine(bx)?
-The period of a sine function is the interval over which the function completes one full cycle. In the function y = sine(bx), the period is affected by the value of 'b' and is calculated as the reciprocal of 'b', i.e., period = 2π / |b|.
What is the basic shape of the cosine graph?
-The basic shape of the cosine graph starts at the maximum (1), goes down to the midline, continues down to the minimum (-1), returns to the midline, and then goes back up to the maximum (1), where it repeats the pattern.
How does the phase shift affect the graph of a sine or cosine function?
-A phase shift affects the horizontal position of the graph. Adding π (or subtracting 2π in the case of cosine) shifts the graph to the left, while subtracting π (or adding 2π for cosine) shifts it to the right. A vertical shift moves the graph up or down, depending on whether the shift value is positive or negative.
What are the asymptotes of the secant and cosecant functions?
-The asymptotes of the secant and cosecant functions occur where the cosine and sine functions, respectively, cross the x-axis. These are the points where the secant and cosecant functions approach but never touch or cross the x-axis.
How does the coefficient 'h' in the function y = A * sine(Bx - h) affect the graph?
-The coefficient 'h' in the function y = A * sine(Bx - h) affects the horizontal shift of the graph. A positive 'h' value shifts the graph to the right, while a negative 'h' value shifts it to the left.
What is the basic shape of the tangent graph?
-The basic shape of the tangent graph consists of alternating vertical asymptotes and lines that approach but never touch the asymptotes, increasing and decreasing in a symmetrical pattern around the y-axis.
How does the coefficient 'k' in the function y = A * tangent(Bx + k) affect the graph?
-The coefficient 'k' in the function y = A * tangent(Bx + k) affects the vertical shift of the graph. A positive 'k' value shifts the graph upwards, while a negative 'k' value shifts it downwards.
What are the unit circle values used for cotangent and how do they affect the graph?
-The unit circle values used for cotangent range from 0 to π (0 to 180 degrees). These values affect the graph by creating vertical asymptotes at points where the cosine value is 0 (π/2 and 3π/2), as cotangent is undefined at these points.
Outlines
📊 Introduction to Trigonometric Graphs
This paragraph introduces the video's purpose, which is to provide a comprehensive guide on graphing sine, cosine, tangent, secant, cosecant, and cotangent functions. It begins with a discussion on how to graph basic sine and cosine graphs and progresses to more complex topics like transformations (shifting, stretching, compressing) and the role of the unit circle in understanding these graphs. The paragraph emphasizes the importance of understanding the basic shapes of these graphs for solving more challenging problems.
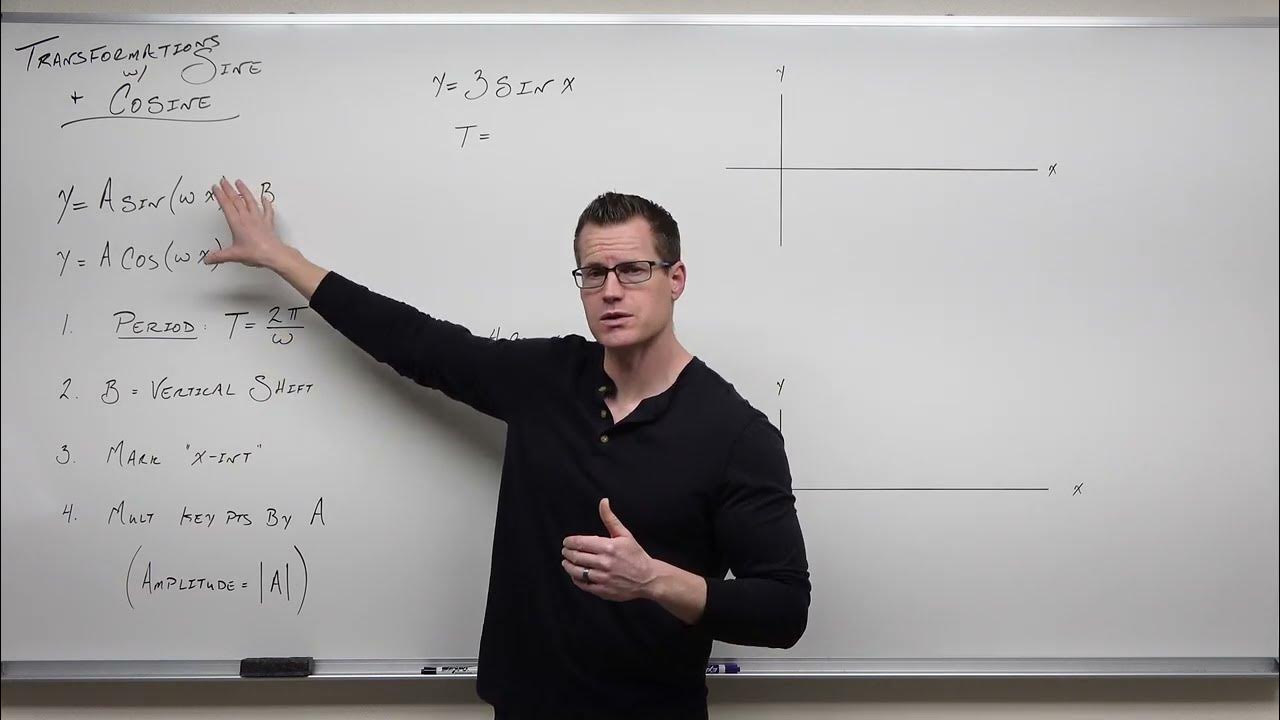
📈 Graphing Sine and Cosine Functions
The paragraph delves into the specifics of graphing sine and cosine functions, explaining how to plot points on the unit circle and how these points translate into the graphs. It covers the effects of amplitude changes on the vertical stretch of the graphs and the impact of the 'B' value on the period of the functions. The paragraph also introduces the concept of phase shifts and vertical shifts, using examples to illustrate how these transformations affect the graphs.
🔄 Understanding Period and Phase Shifts
This section focuses on the concepts of period and phase shifts in trigonometric functions. It explains how to calculate the period using the 'B' value and how phase shifts affect the position of the graph on the coordinate axis. The paragraph uses examples of sine and cosine functions with different 'B' values and phase shifts to demonstrate the changes in their periods and the shifts in their starting points.
📊 Graphing Secant and Cosecant Functions
The paragraph discusses the reciprocal nature of secant and cosecant functions in relation to cosine and sine, respectively. It explains how to graph these functions, including the identification of vertical asymptotes where the cosine or sine function equals zero. The paragraph also covers the impact of coefficients and 'B' values on the shape and period of secant and cosecant graphs, using examples to illustrate these concepts.
📈 Advanced Trigonometric Graphs
This section tackles more complex trigonometric graphs involving multiple transformations. It explains how to graph functions with combined amplitude, period, phase shift, and vertical shift changes. The paragraph uses specific examples to demonstrate how these transformations affect the graph, including the calculation of new periods and the visualization of phase and vertical shifts on the graphs.
📊 Graphing Tangent and Cotangent Functions
The paragraph shifts focus to tangent and cotangent functions, explaining their relationship with the unit circle and the specific values used for these functions. It discusses the graphing of tangent and cotangent functions, including the identification of vertical asymptotes and the impact of coefficients on the vertical stretch or shrink of the graphs. The paragraph also covers the effects of 'B' values on the period of these functions and provides examples to illustrate these concepts.
📈 Complex Trigonometric Graphs and Shifts
This section deals with more complex scenarios in trigonometric graphing, particularly focusing on the combined effects of amplitude, period, and phase shifts on tangent and cotangent graphs. The paragraph provides a detailed explanation of how to calculate the period and how to visualize the shifts on the graphs. It uses specific examples to demonstrate the transformations and their impact on the overall shape and position of the graphs.
🎓 Conclusion and Channel Promotion
The final paragraph wraps up the video by encouraging viewers to subscribe to the channel for more content on making math learning less stressful. It reiterates the channel's goal of helping viewers improve their math grades and achieve their academic dreams. The paragraph serves as a call to action for viewers to engage with the channel for future educational content.
Mindmap
Keywords
💡Sine Function
💡Cosine Function
💡Tangent Function
💡Period
💡Amplitude
💡Phase Shift
💡Vertical Asymptote
💡Secant Function
💡Cosecant Function
💡Cotangent Function
Highlights
The video provides a comprehensive guide on graphing sine, cosine, tangent, secant, cosecant, and cotangent functions.
The basic sine graph is explained with key points at 0, 45, 90, 180, 270, and 360 degrees.
The amplitude affects the vertical stretch of the graph, doubling the amplitude changes the peak values from 1 to 2.
The period of a function is affected by the coefficient 'B', with a formula for new period being 'Period = 2π / B'.
The sine function graph is vertically stretched and horizontally compressed to form the graph of y = 2 * sin(2x).
Shifts in the graph are described by the 'h' and 'k' values, shifting the graph left or right and up or down.
The basic cosine graph is explained with key points at 0, 90, 180, 270, and 360 degrees.
The negative sign in front of the cosine function reflects the graph over the x-axis.
Changing the 'B' value in the cosine function affects the period, demonstrating how to find the new period with the formula.
The secant and cosecant functions are the reciprocals of the cosine and sine functions, respectively.
The secant graph has vertical asymptotes where the cosine graph crosses the x-axis.
The tangent function graph is explained with asymptotes and key points within the range of -π/2 to π/2.
The cotangent function graph is explained with asymptotes and its unique behavior compared to tangent, with key points from 0 to π.
The video concludes with more challenging examples involving all components (A, B, h, and k) and their effects on the graphs.
The amplitude and period changes are demonstrated with an example of y = 3 * sin(1/2 * x - π) - 2.
The video emphasizes the importance of understanding the basic shapes of sinusoidal graphs for solving more complex problems.
Transcripts
Browse More Related Video
Graphing Trigonometric Functions, Phase Shift, Period, Transformations, Tangent, Cosecant, Cosine
Graphing Sine and Cosine Trig Functions With Transformations, Phase Shifts, Period - Domain & Range
Graphing Transformations with Sine and Cosine (Precalculus - Trigonometry 12)

How to Graph Cosecant and Secant (Precalculus - Trigonometry 15)
Graphing Trigonometric Functions

Graphing Transformations with Tangent and Cotangent (Precalculus - Trigonometry 14)
5.0 / 5 (0 votes)
Thanks for rating: