Elementary Stats Lesson #1
TLDRThis transcript from an elementary statistics class introduces the fundamental concepts of statistics as a science for collecting, organizing, summarizing, and analyzing data to reach conclusions with a measure of confidence. It emphasizes the importance of statistical reasoning in modern society and outlines the process of statistical analysis, including defining research objectives, data collection, descriptive statistics, and inferential statistics. The instructor highlights the difference between statistics and parameters, the role of variables, and the significance of using random sampling to avoid bias and ensure representative data.
Takeaways
- 📚 The course is about elementary statistics, aiming to introduce basic ideas and language for statistical reasoning.
- 🗣️ H.G. Wells once stated that statistical reasoning would be as necessary as reading and writing, a sentiment that rings true today.
- 🔍 Statistics is defined as the science of collecting, organizing, summarizing, and analyzing information to reach conclusions or answer questions.
- 📈 Statistics also involves providing a measure of confidence in results, acknowledging that conclusions are not 100% certain.
- 📝 The process of statistics includes four phases: data collection, organizing and summarizing, analyzing, and making decisions with confidence.
- 🔢 Data represents information collected about a specific characteristic for a group of individuals and can be categorized into qualitative (categorical) or quantitative (numerical).
- 📊 Qualitative variables are further divided into nominal (no order) and ordinal (ordered categories), while quantitative variables are discrete (countable) or continuous (infinite possibilities).
- 🎯 The course's main goal is to tell a 'statistical story' by organizing data and performing inference to reach conclusions about a population from sample data.
- 🔑 Key terms such as 'sample', 'population', 'statistic', and 'parameter' differentiate between subsets of data and their summaries, with statistics referring to samples and parameters to entire populations.
- 🚫 To avoid sampling bias and ensure reliability, the gold standard for data collection is a simple random sample (SRS), where every member of the population has an equal chance of being selected.
- ⚠️ Convenience sampling is discouraged as it can lead to biased and unreliable results due to non-random selection of individuals.
Q & A
What is the main focus of the first lesson in the elementary statistics course?
-The main focus of the first lesson is to introduce basic ideas from the first chapter of the textbook, define what statistics is, and discuss the importance of statistical reasoning in today's world.
According to H.G. Wells, why is statistical reasoning important for efficient citizenship?
-H.G. Wells stated that statistical reasoning will be as necessary for efficient citizenship as the ability to read and write, emphasizing its significance in making informed decisions and understanding the world around us.
What are the four main components of statistics as defined in the script?
-The four main components of statistics are collecting, organizing, summarizing, and analyzing information, all aimed at reaching a conclusion or answering a posed question.
What is the difference between a statistic and a parameter in the context of statistics?
-A statistic is a numerical summary that describes a sample, while a parameter is a numerical summary that describes an entire population.
Why is it important to provide a measure of confidence in statistical results?
-Providing a measure of confidence in statistical results is important because unlike other mathematical procedures, statistical conclusions are not 100% certain and it indicates the level of certainty or accuracy of the results.
What are the two main types of variables discussed in the script?
-The two main types of variables discussed are qualitative (or categorical) and quantitative (or numerical) variables.
Can you explain the difference between nominal and ordinal qualitative variables?
-Nominal variables are the most basic categories with just labels, whereas ordinal variables have categories with a natural order, allowing for a ranking or hierarchy among the categories.
How are discrete and continuous quantitative variables distinguished?
-Discrete variables are those where data is collected by counting and have a finite or countable number of possibilities. Continuous variables, on the other hand, have infinite possible values within a range and data is collected by measuring.
What is the goal of the semester in the elementary statistics course?
-The goal of the semester is to learn how to tell a statistical story by collecting data for a sample, organizing and summarizing it, analyzing it, and then making inferences to reach conclusions about the whole population with a certain measure of confidence.
Why is random sampling considered the gold standard in statistical data collection?
-Random sampling is considered the gold standard because it ensures that every possible sample has an equal chance of being selected, which helps to avoid sampling bias and provides a representative sample of the population.
What is the main difference between a simple random sample and convenience sampling?
-A simple random sample is obtained through complete random chance, ensuring a representative sample. Convenience sampling, however, is when individuals are selected based on availability or ease, which can lead to biased and unreliable results.
Outlines
📚 Introduction to Elementary Statistics
The instructor begins the first lesson of the semester by introducing the course on elementary statistics and emphasizing the importance of statistical reasoning in today's society. H.G. Wells' quote is cited to highlight the necessity of statistical literacy. The lesson outlines the four main components of statistics: collecting, organizing, summarizing, and analyzing data to reach conclusions or answer questions. A secondary concept, the measure of confidence in statistical results, is introduced, noting that unlike exact mathematical answers, statistical conclusions are not 100% certain and require expressing a level of confidence.
🔍 Understanding Statistics and Data
The instructor delves into the definition of statistics, explaining it as a scientific branch for information processing. The focus then shifts to data, which is defined as information collected to draw conclusions. The instructor clarifies that data pertains to specific characteristics, known as variables, within a defined group of individuals. Variables are categorized into qualitative (categorical) and quantitative (numerical) types, with further subdivisions into nominal, ordinal for qualitative, and discrete and continuous for quantitative variables. The importance of distinguishing between these types for appropriate statistical analysis is underscored.
📈 The Nature of Quantitative Variables
This paragraph further explores the characteristics of quantitative variables, differentiating between discrete variables, which are finite or countable, and continuous variables, which have infinite possible values within a range. The instructor provides examples for each type and offers a simple rule of thumb to distinguish between them: if data is collected by counting, the variable is discrete; if by measuring, it is continuous. The significance of this distinction for selecting the correct statistical methods is emphasized.
🎯 Setting Goals for Statistical Learning
The instructor outlines the goals for the semester, aiming to tell a 'statistical story' with a clear beginning, middle, and end. The process involves data collection, organizing and summarizing information, and performing data analysis to reach conclusions. The overarching objective is to use sample data to make inferences about an entire population, a process that requires developing confidence in statistical procedures. The instructor introduces key statistical terms such as population, individual, sample, statistic, and parameter, highlighting their definitions and differences.
🔢 The Role of Variables and the Statistical Process
The concept of variables as characteristics that vary within a population is discussed, emphasizing the importance of understanding variability to make sound inferences. The instructor explains that statistics is a process that provides less-than-100% accurate answers, differing from other mathematical disciplines. The textbook's author outlines a four-stage process of statistics: identifying research objectives, collecting data, packaging information, and performing inference. The instructor stresses the importance of this process in learning statistics.
📝 Best Practices in Data Collection
The instructor discusses the importance of proper data collection to avoid sampling bias and ensure representative samples. The goal is to obtain a sample that mirrors the population for accurate statistical inference. Simple random sampling (SRS) is presented as the gold standard for sampling, where every individual in the population has an equal chance of being selected. The instructor warns against convenience sampling, which can lead to biased and unreliable results, and emphasizes the need for random selection in obtaining a good sample.
🚫 Avoiding Bias in Sampling
The final paragraph reinforces the importance of avoiding sampling bias by using simple random sampling to ensure that the sample is representative of the entire population. The instructor contrasts SRS with convenience sampling, which can lead to meaningless results due to intentional selection bias. The lesson concludes with an overview of the semester's direction and an invitation for students to complete the first assignment on MyMathLab, looking forward to the next lesson on descriptive statistics.
Mindmap
Keywords
💡Statistics
💡Measure of Confidence
💡Data Collection
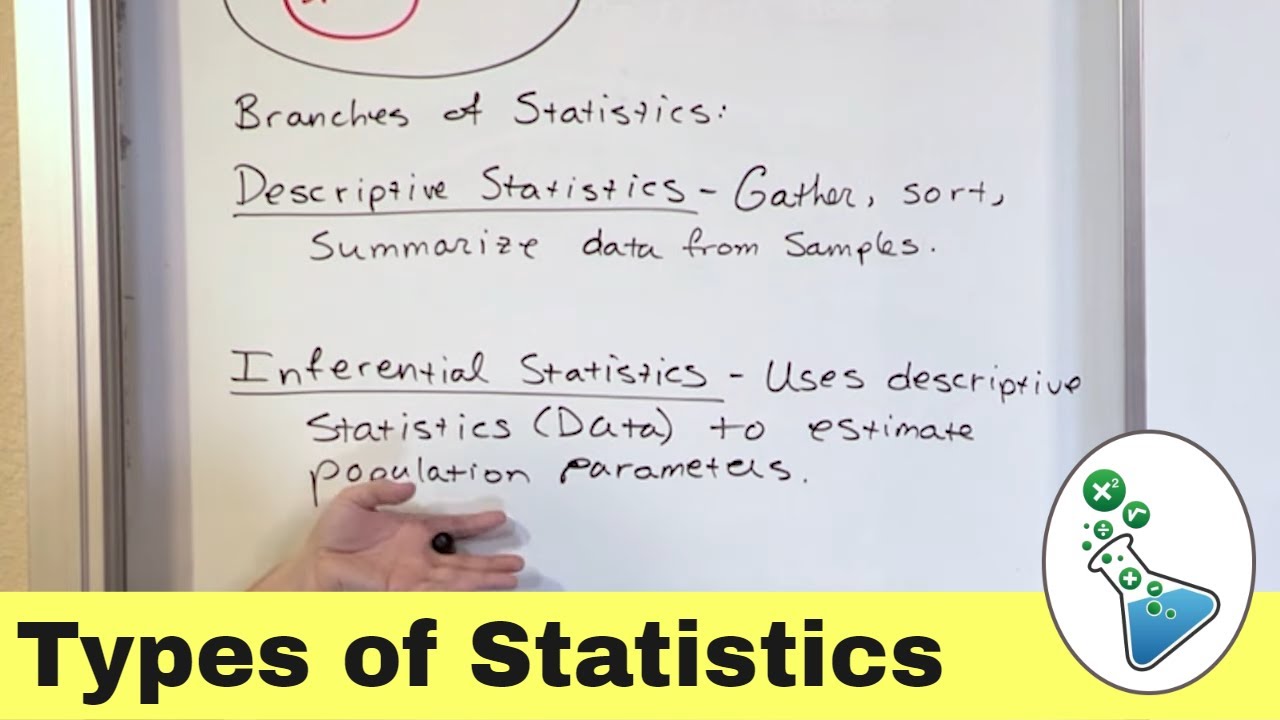
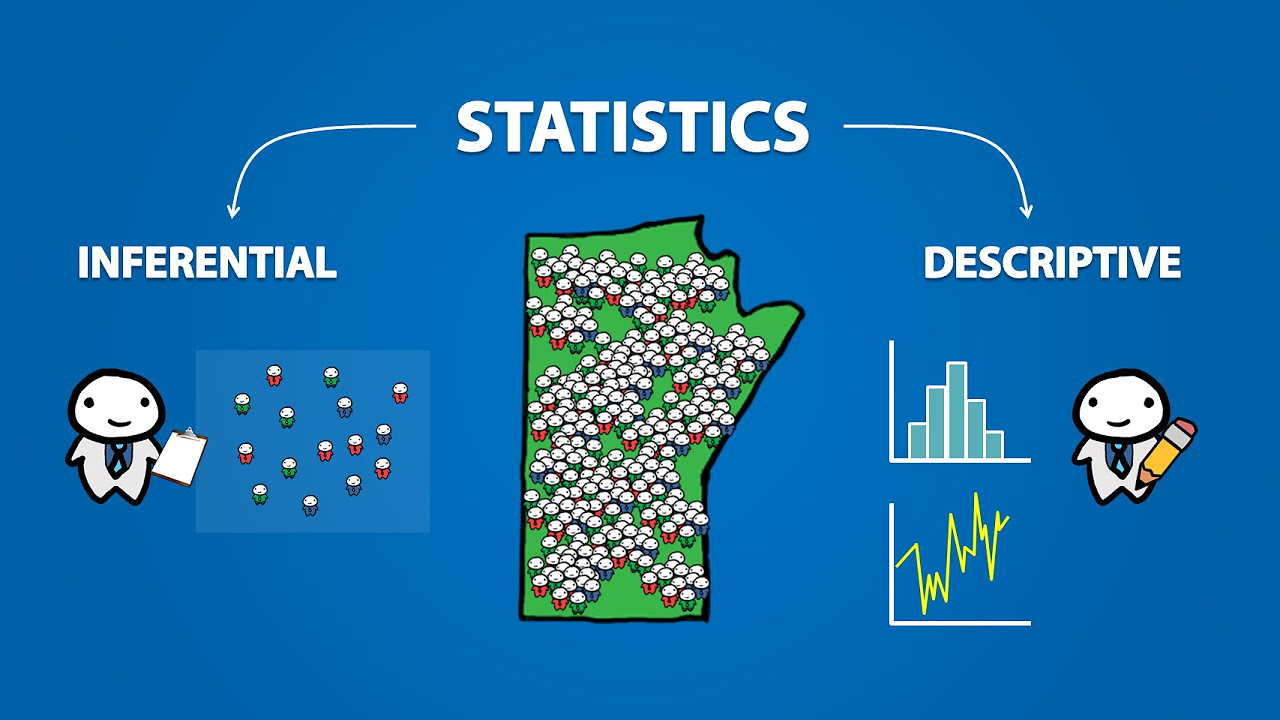
💡Descriptive Statistics
💡Inferential Statistics
💡Variables
💡Qualitative Variables
💡Quantitative Variables
💡Discrete Variables
💡Continuous Variables
💡Population and Sample
💡Sampling Bias
💡Simple Random Sample (SRS)
💡Convenience Sampling
Highlights
The course introduces the fundamental concepts of elementary statistics.
H.G. Wells' quote emphasizes the importance of statistical reasoning in modern society.
Statistics is defined as the science of collecting, organizing, summarizing, and analyzing information.
Statistics aims to provide a measure of confidence in results, unlike other mathematical procedures.
Data collection is the first phase of the statistical process.
Descriptive statistics involves organizing and summarizing data.
Inferential statistics is used to analyze data and make conclusions with a measure of confidence.
Data is information collected and used to reach conclusions about a specific characteristic.
Variables are characteristics of individuals that are of interest in a study.
Qualitative variables categorize individuals into groups without a numerical value.
Quantitative variables are numerical and can be either discrete or continuous.
Discrete variables have a finite or countable number of possibilities.
Continuous variables have infinite possible values within a range.
The course's goal is to tell a statistical story through data collection, organization, and analysis.
A simple random sample is the gold standard for obtaining a representative sample of the population.
Sampling bias can be avoided by using a simple random sample, ensuring reliability in statistical inference.
Convenience sampling is discouraged as it can lead to unreliable and biased results.
Transcripts
Browse More Related Video

Tutorial 1- What Is Statistics And What Are Its Types In Hindi?
What is Descriptive Vs. Inferential Statistics?
Introduction to Statistics (1.1)
What Is Statistics: Crash Course Statistics #1
Statistics Terminology and Definitions| Statistics Tutorial | MarinStatsLectures

What is Statistics? | Types of Statistics | Descriptive & Inferential Statistics | Acadgild
5.0 / 5 (0 votes)
Thanks for rating: