Statistics: Populations & Samples and Parameters vs Statistics
TLDRProfessor Williams discusses the fundamental concepts of populations, samples, parameters, and statistics in statistical studies. He explains that a population is the group of interest for study, which can be an existing group or one created for research. Due to the challenges of conducting a census, sampling is commonly used to obtain a subset of the population. He emphasizes the difference between descriptive statistics from samples and statistical inference, which allows for conclusions about the population based on the sample. Noting the inherent error in sampling, he introduces statistical notations to differentiate between sample statistics and population parameters, such as using 'n' for sample size and 'N' for population size, and explains the symbols for mean, variance, standard deviation, and proportion.
Takeaways
- 📝 A population is the entire group of interest that we want to study and gather information about.
- 🔍 A census involves examining every individual within the population, which can be challenging due to size and accessibility.
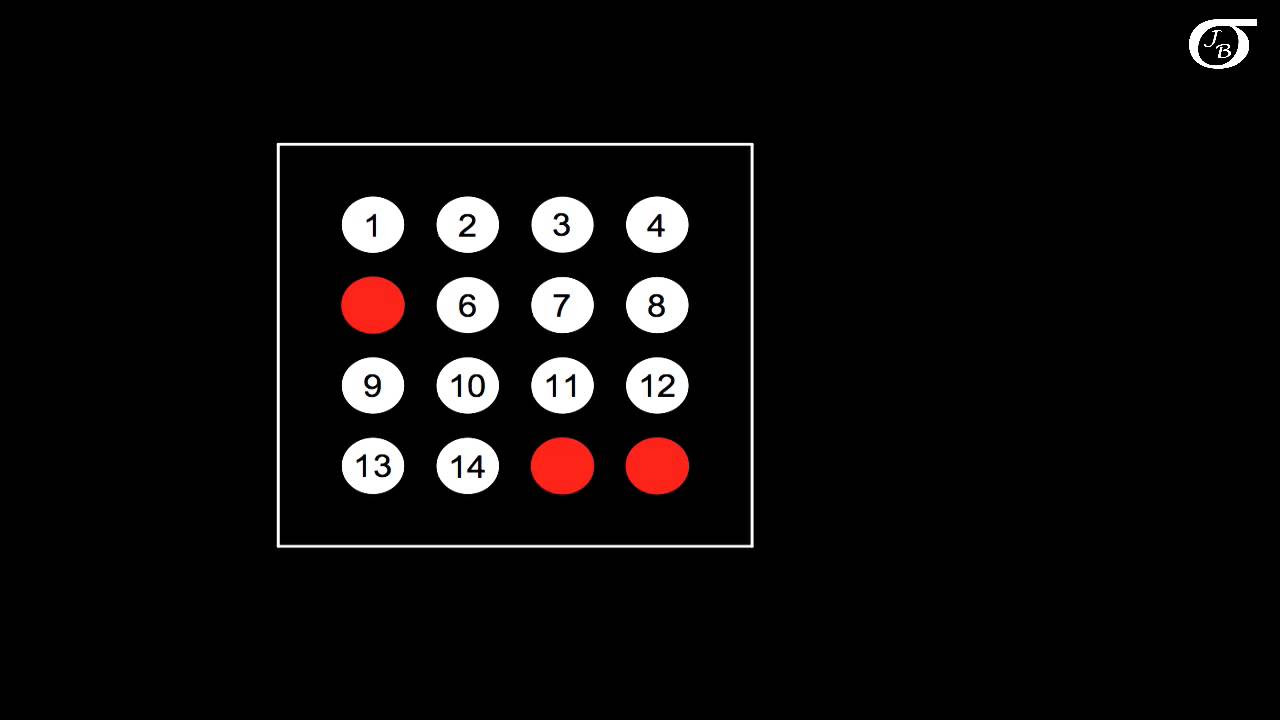
- 🔨 The most common way to study a population is through sampling, which is taking a randomly selected subset of the population.
- 📊 Descriptive statistics are used to describe and analyze sample data, but do not allow for generalizations about the entire population.
- 🧠 Statistical inference is the process of making deductions about the population based on sample data.
- 🔄 There is always some degree of error when moving from sample data back to the population.
- 📈 Parameters are numerical measures used to describe a population, and are often unknown, estimated from sample statistics.
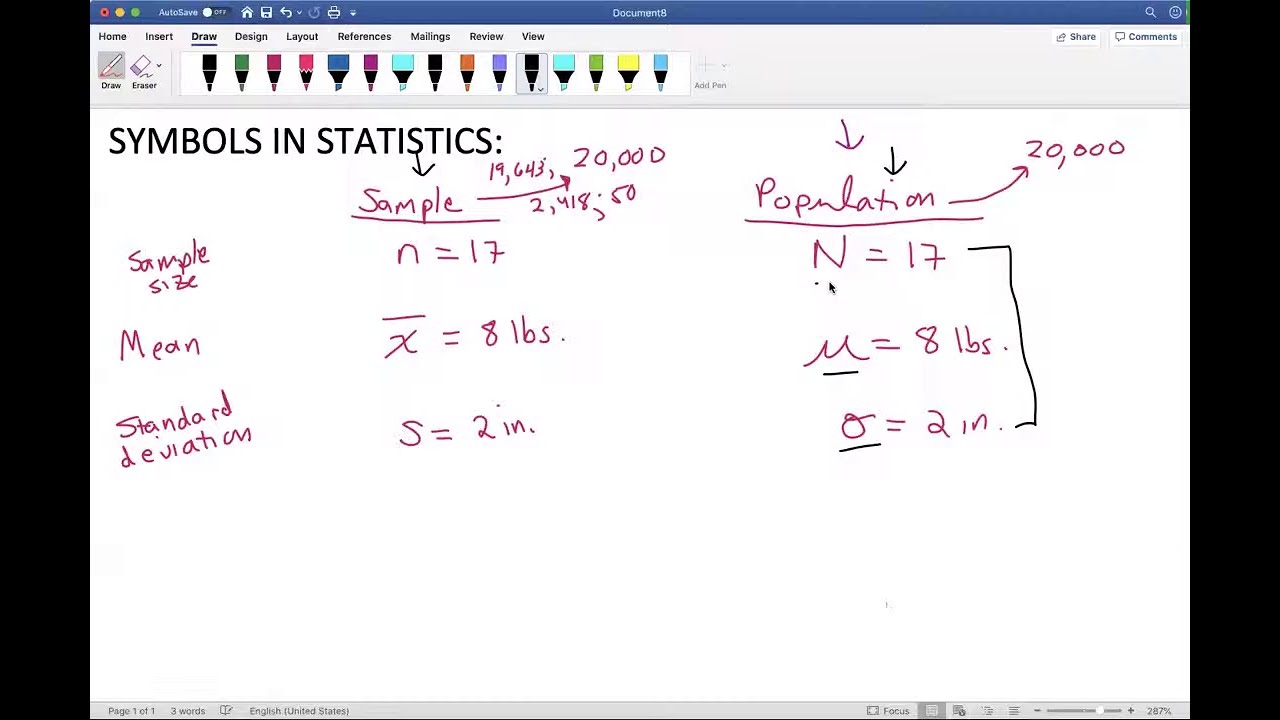
- 📐 A sample's size is denoted by 'n', while the population size is denoted by 'N'.
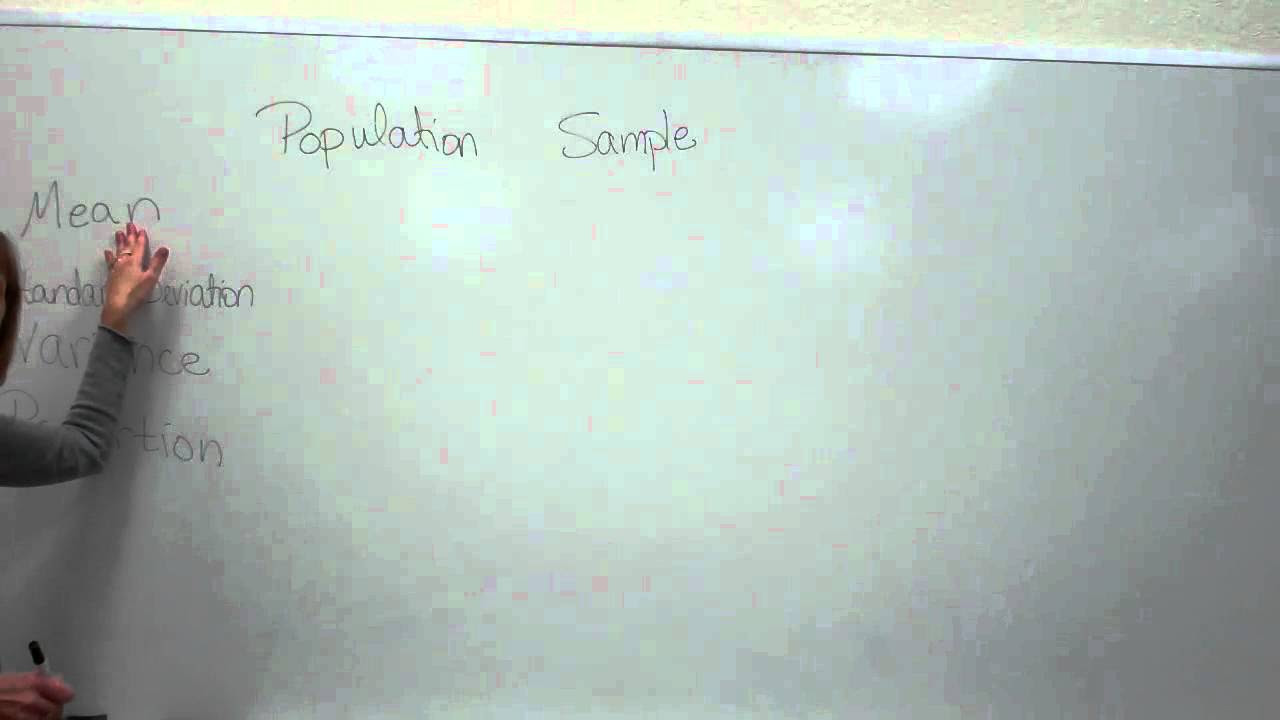
- 📊 The sample mean is represented by 'x̄', and the population mean is represented by the Greek letter 'μ'.
- 📐 For variance and standard deviation, 's' is used for the sample and the Greek letter 'σ' for the population.
- 📊 The sample proportion is denoted by 'p̂' (with a hat), and the population proportion is denoted by 'P' or sometimes the Greek letter 'π'.
Q & A
What is the main difference between a population and a sample in statistics?
-A population is the entire group of interest that we want to study and gather information about. It can be an existing group or one defined by the researcher. A sample, on the other hand, is a smaller, randomly selected subset of the population that is used to represent and make inferences about the entire population.
Why is it challenging to study populations directly?
-Studying populations directly can be challenging because populations can be hard to locate, and in some cases, they may be of infinite size, making it impractical or impossible to collect data from every single member.
What is the purpose of sampling in statistics?
-Sampling is used when it is not feasible to study an entire population. By taking a representative subset of the population, researchers can examine the sample, describe its characteristics numerically, and make inferences about the larger population without having to collect data from every individual.
What is statistical inference, and how does it relate to populations and samples?
-Statistical inference is the process of making deductions or drawing conclusions about a population based on the data collected from a sample. It involves using the numerical characteristics of the sample to estimate or predict what is true for the entire population.
What is the main challenge when making inferences from a sample back to the population?
-The main challenge is that there is always some degree of error present when moving from sample data back to the population. This is because the sample may not perfectly represent the population, and the estimates derived from the sample will have a margin of error.
How is a parameter different from a statistic in statistical terms?
-A parameter is a numerical characteristic that describes a population, often an unknown value that we are trying to estimate. A statistic, on the other hand, is a numerical characteristic that describes a sample. We use sample statistics to make inferences about population parameters.
What are the notations used for sample size and population size in statistical notation?
-In statistical notation, the sample size is denoted by 'n' (small n), while the population size is denoted by 'N' (capital N).
How are the sample mean and population mean represented in statistical notation?
-The sample mean is represented by 'x̄' (x bar), and the population mean is represented by the Greek letter 'μ' (mu).
What are the notations for sample variance, population variance, sample standard deviation, and population standard deviation?
-For the sample variance, we use 's', and for the population variance, we use the Greek letter 'σ' (sigma). The sample standard deviation is also denoted by 's', while the population standard deviation is represented by 'σ' as well.
How are sample proportion and population proportion denoted in statistical notation?
-The sample proportion is denoted by 'p̂' (p hat), and the population proportion is denoted by 'p' (capital p). Sometimes, the population proportion is also represented by the Greek letter 'π' (pi).
What is the significance of using different notations for sample and population measurements?
-Using different notations helps differentiate between sample statistics and population parameters, which is crucial for accurate data analysis and interpretation. It allows researchers to clearly communicate their findings and avoid confusion when discussing results.
How can we ensure that our samples are representative of the population?
-To ensure that samples are representative of the population, researchers should use appropriate sampling methods that produce a subset with characteristics similar to the entire population. These methods can vary in cost and complexity, with more expensive and complex procedures often yielding more representative samples and better generalizability.
Outlines
📚 Introduction to Populations, Samples, Parameters, and Statistics
This paragraph introduces the fundamental concepts of populations and samples, as well as parameters and statistics. A population is defined as the entire group of interest for a study, which can be pre-existing or created by the researcher. The challenge of studying entire populations often leads to the use of sampling, where a randomly selected subset of the population is examined. The distinction between descriptive statistics, which are numerical measures derived from a sample, and statistical inference, which involves making conclusions about the population based on the sample, is highlighted. It is emphasized that there is always some degree of error when inferring from a sample to the population.
Mindmap
Keywords
💡Population
💡Sample
💡Parameter
💡Statistic
💡Statistical Inference
💡Census
💡Descriptive Statistics
💡Error
💡Variance
💡Standard Deviation
💡Proportion
Highlights
Professor Williams introduces the key concepts of populations, samples, parameters, and statistics.
A population is the group of interest that we want to study and gather information about.
Examples of populations include existing groups like voters in the United States over the age of 50 or created groups like college juniors in Virginia.
A census is a method to examine every individual within a population, but it can be challenging due to the difficulty in locating populations or their infinite size.
Sampling is a common alternative to a census, where a randomly selected subset of the population is taken to represent and study the whole.
Descriptive statistics are used to numerically describe or characterize the sample, but statistical inference allows us to make inferences about the population from the sample.
There is always some degree of error when moving from sample data back to the population, which is an important concept to remember.
Parameters are used to describe the population, often an unknown value that we estimate from our sample.
Statistics are numerical measurements computed from sample data.
The distinction between population and sample is crucial; for instance, the sample size is denoted by 'n', while the population size is denoted by 'N'.
The sample mean is represented by 'x̄', while the population mean is symbolized by the Greek letter 'μ'.
For variance and standard deviation, 's' is used for the sample, and the Greek letter 'σ' is used for the population.
The sample proportion is denoted by 'p̂' with a hat, whereas the population proportion is represented by 'P' or sometimes the Greek letter 'π'.
Statistical notation is essential for differentiating between population parameters and sample statistics.
The lecture provides a clear and concise overview of basic statistical concepts and their applications.
Understanding these concepts is crucial for anyone studying statistics or conducting research.
The mnemonic 'populations produce parameters and samples produce statistics' helps to remember the difference between the two.
Transcripts
Browse More Related Video
Symbols commonly used in statistics
Sampling Distributions: Introduction to the Concept
Symbols in statistics. Sample or Population?
Calculating the Mean, Variance and Standard Deviation, Clearly Explained!!!
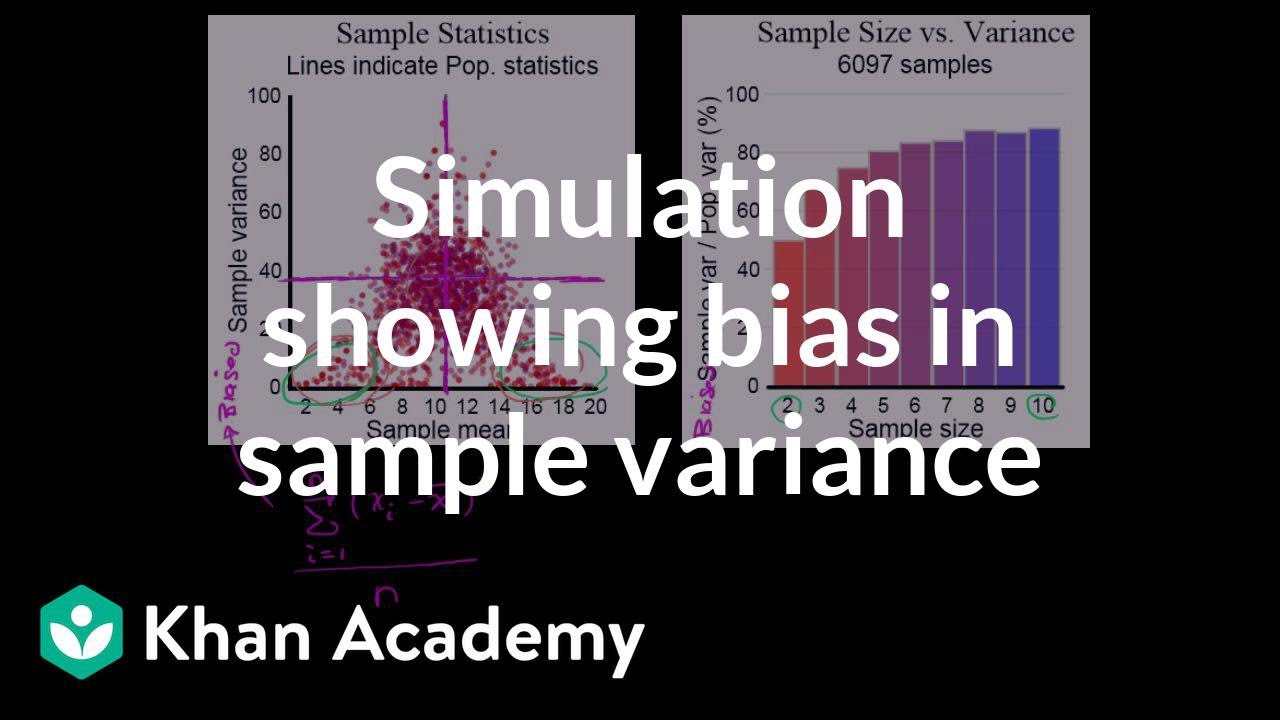
Simulation showing bias in sample variance | Probability and Statistics | Khan Academy
Populations, Samples, Parameters, and Statistics
5.0 / 5 (0 votes)
Thanks for rating: