Motion diagrams | Physics with Professor Matt Anderson | M2-01
TLDRIn this educational talk, Professor Anderson introduces the concept of motion diagrams, a visual tool for understanding the movement of objects. By using the example of a person running and taking stroboscopic pictures at different intervals, he explains how to interpret changes in position and speed. The discussion transitions into creating a motion diagram with dots representing positions at different times, and numerical data is used to illustrate constant speed. The session culminates with the creation of a position versus time graph, highlighting the relationship between constant velocity and zero acceleration, offering valuable insights into the physics of motion.
Takeaways
- 🏃 Motion diagrams are visual tools to represent the movement of objects, like a person running.
- 📸 A stroboscopic picture of a runner captures positions at different intervals, showing motion over time.
- 🎥 In the past, film cameras could expose film for a long time to take multiple strobe pictures of moving objects.
- 📊 To analyze motion, one must first establish a positive or negative direction for position changes.
- 📈 By observing the differences in position over time, one can determine if speed is increasing, decreasing, or constant.
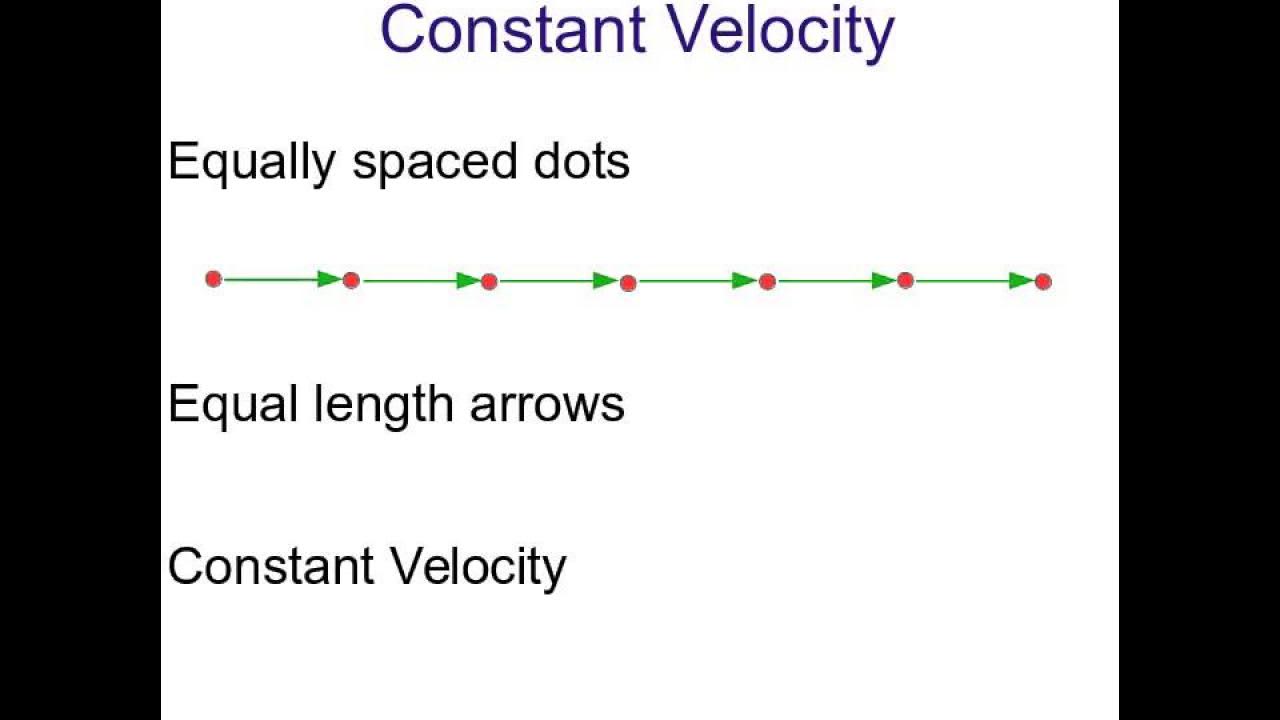
- 🏃♂️ A runner's motion can be simplified to dots at different time intervals, avoiding the need to draw multiple images.
- 📐 Given numerical data, one can plot a position versus time graph to understand motion characteristics.
- 🕒 Time intervals in the graph correspond to the duration between each captured position.
- 🏁 A straight line on a position versus time graph indicates constant speed or velocity.
- 🔢 The position versus time graph provides insights into an object's position, velocity, and acceleration over time.
- 🛑 An object moving at a constant speed will have zero acceleration, as there is no change in velocity.
Q & A
What is the purpose of a motion diagram?
-A motion diagram is used to visualize the movement of objects in the universe, providing a snapshot of an object's position at different instances in time.
How would a stroboscopic picture of a person running appear in a motion diagram?
-The stroboscopic picture would show the person in different positions at various moments, with the assumption that their legs are moving in between the flashes.
What is the significance of deciding a positive or negative direction in a motion diagram?
-Deciding a positive or negative direction is crucial to determine whether the object's position is increasing or decreasing over time.
How can one determine if an object is speeding up, slowing down, or moving at a constant speed using a motion diagram?
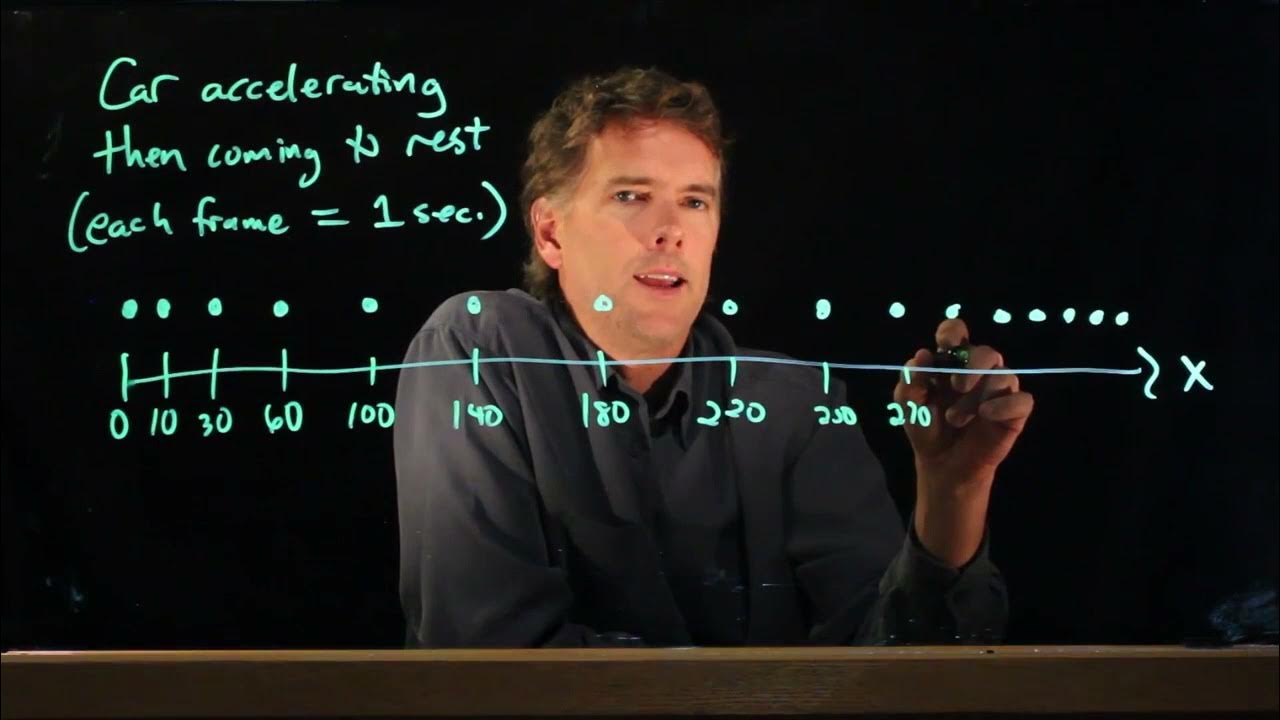
-By observing the deltas (differences) between the positions in the diagram, one can infer if the speed is increasing (widening deltas), constant (uniform deltas), or decreasing (narrowing deltas).
What is the relationship between the dots in a motion diagram and the time intervals?
-The dots represent the position of the object at different time intervals, allowing for the visualization of the object's movement over time.
How can numerical data enhance the understanding of a motion diagram?
-Numerical data, such as distances covered in specific time intervals, can help determine the speed and acceleration of the object, providing a more detailed analysis of its motion.
What is the position-time (x vs. t) graph derived from the motion diagram in the script?
-The x vs. t graph is a straight line that shows the object's position increasing linearly with time, indicating constant speed.
What does the slope of the line in a position-time graph represent?
-The slope of the line in a position-time graph represents the object's velocity; in this case, a constant velocity of 10 meters per second.
What can the acceleration be inferred as from a graph showing constant speed?
-If the graph shows constant speed, the acceleration is zero, as there is no change in the velocity over time.
Why is it important to be able to plot and interpret motion diagrams and position-time graphs?
-Plotting and interpreting these diagrams and graphs provide valuable insights into an object's position, velocity, and acceleration over time, which are fundamental aspects of understanding motion.
Outlines
🏃♂️ Understanding Motion and Diagrams
This paragraph introduces the concept of motion diagrams as a method to visualize the movement of objects, using the example of a person running. It explains how stroboscopic images can capture different positions of a moving person over time, and how these images can be analyzed to determine if the object's position is increasing or decreasing. The paragraph also discusses the importance of establishing a positive or negative direction for the motion and how to represent the motion diagram with dots and numerical values to indicate distance and time intervals. The example provided shows a person running at a constant speed, with equal distances covered in each second, resulting in a straight line graph when plotted against time.
📈 Interpreting Velocity and Acceleration from Graphs
The second paragraph delves into the interpretation of velocity and acceleration from a position versus time graph. It explains that a constant velocity is indicated by a constant speed throughout the motion, which is represented by a straight line on the graph. The paragraph emphasizes that the graph provides valuable information not only about the position of the object but also its velocity and acceleration as functions of time. It clarifies that zero acceleration indicates uniform motion, and the ability to plot and understand these graphs is crucial for analyzing motion.
Mindmap
Keywords
💡Motion Diagrams
💡Stroboscopic Picture
💡Position
💡Velocity
💡Acceleration
💡Time Intervals
💡Constant Speed
💡Delta (Δ)
💡Graphs
💡Kinematics
💡Direction
Highlights
Introduction to motion diagrams as a visualization tool for object movement.
Description of a stroboscopic picture of a person running to illustrate motion.
The importance of establishing a positive or negative direction in motion analysis.
Observation that the person's position is increasing, indicating motion to the right.
Discussion on the change in speed indicated by varying intervals between positions.
Explanation of how to simplify motion diagrams with dots and time intervals.
Use of numerical data to analyze and understand constant speed motion.
Construction of a position versus time graph (x vs. t) from motion data.
Interpretation of the position versus time graph to determine constant velocity.
Zero acceleration in constant speed motion as explained by the graph.
The comprehensive information provided by a position versus time graph, including position, velocity, and acceleration.
The significance of being able to plot and interpret these graphs for understanding motion.
Historical context of film cameras and their use in early motion studies.
The transition from film cameras to digital technology in capturing motion.
The concept of delta (change) between positions and its relevance to speed analysis.
The practical example of a person running at 10 meters per second and its representation on the graph.
Transcripts


5.0 / 5 (0 votes)
Thanks for rating: