Motion Diagram for an Accelerating Car | Physics with Professor Matt Anderson | M2-02
TLDRIn this educational segment, Professor Anderson illustrates the concept of motion diagrams using the example of a car accelerating from a stop and then coming to rest. He explains that motion diagrams consist of a series of dots, with each dot representing a second of time. By plotting the car's position at each second, the diagram shows an increase in displacement until the car begins to slow down. The professor provides a step-by-step guide on how to plot the car's position over time, resulting in a graph that visually represents the car's acceleration and deceleration phases. This practical demonstration helps viewers understand the relationship between position, displacement, and time in motion analysis.
Takeaways
- 🚗 The example discusses a car's motion, accelerating from a stop and then coming to rest.
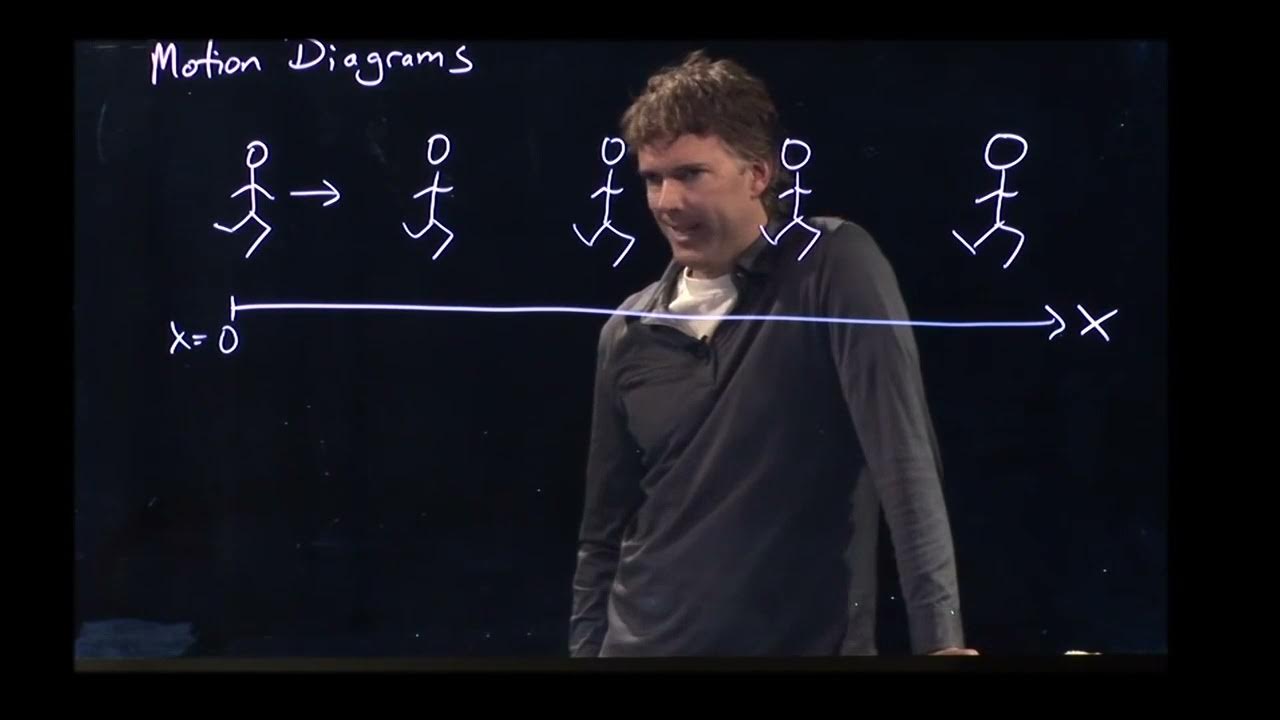
- 📈 Motion diagrams are used to visualize an object's movement over time, represented by a series of dots or frames, each corresponding to one second.
- 📊 The position of the car increases as it accelerates, and the intervals between the dots (displacement) get larger before getting smaller as it decelerates.
- 🏁 The car's journey starts at position one, accelerates through various positions (10m, 30m, 60m, 100m, etc.), and eventually slows down to a stop at position 290.
- 📐 The script provides real numbers to plot the car's motion: x = 0 at the start, increasing to x = 290 at the end.
- 🕒 Time intervals are consistent at one second each, which helps in plotting x as a function of time.
- 📝 The initial attempt at plotting the motion was too steep, so a more shallow graph was used for better representation.
- 🎥 The motion diagram helps in visualizing the car's acceleration, constant speed, and deceleration phases.
- 👨🏫 The script is from a lecture or class, as indicated by the presence of a professor and a class setting.
- 🤔 The exercise aims to aid understanding of motion by providing a practical example and visual representation.
- ❓ The professor encourages students to seek clarification during office hours if the concept is not clear.
Q & A
What is the main topic of the transcript?
-The main topic of the transcript is the explanation of a car's motion diagram, illustrating the process of acceleration from a stop and then coming to rest.
How are motion diagrams represented?
-Motion diagrams are represented as a series of dots, with each dot or frame corresponding to one second of time.
What happens to the position of the car in the motion diagram as it accelerates?
-As the car accelerates, the position on the motion diagram increases, showing a displacement to the right.
How does the motion diagram change when the car starts to slow down?
-When the car slows down, the intervals between the dots on the motion diagram get smaller, indicating a decrease in displacement per second.
What is the significance of the delta x in the motion diagram?
-The delta x represents the change in position between each segment of the motion diagram, which varies as the car accelerates and decelerates.
How is the motion diagram plotted as a function of time?
-The motion diagram is plotted with time on the horizontal axis and position on the vertical axis, with each second corresponding to a marker and the position increasing from left to right.
What are the real numbers used in the example to plot the car's motion?
-The real numbers used in the example are distances in meters (10, 30, 60, 100, 140, 180, 220, 250, 270, 280, 285, 288, 289, and 290) to represent the car's position at different seconds.
Why is it necessary to adjust the graph when plotting the motion diagram?
-It is necessary to adjust the graph because the steep increase in position at the beginning of the motion would cause the graph to run out of room, so a more shallow slope is used to accurately represent the motion over time.
What does the final motion diagram represent?
-The final motion diagram represents the car's motion as a series of points, with a line drawn to aid the eye, showing phases of acceleration, constant speed, and deceleration.
What is the purpose of motion diagrams in physics?
-Motion diagrams help visualize the motion of an object over time, allowing for a better understanding of the object's movement, acceleration, and deceleration.
How can students seek further clarification on the topic?
-Students can seek further clarification by visiting the professor during office hours.
Outlines
🚗 Car Acceleration and Motion Diagrams
Professor Anderson introduces the concept of motion diagrams to visualize the movement of a car accelerating from a stop and then coming to rest. The discussion includes plotting the car's position over time, starting from rest at a green light, driving for a bit, and stopping at the next stop light. The motion diagram is described as a series of dots, with each dot representing one second of time. The position of the car increases as it accelerates and decreases as it slows down. Real numbers are used to illustrate the motion, with the car's position increasing from 0 to 290 meters over 15 seconds. The process of plotting x as a function of time is explained, with the initial steep incline indicating the acceleration and the subsequent flattening as the car slows down.
📈 Plotting Motion on a Graph
This paragraph continues the explanation of plotting the car's motion on a graph. It discusses the challenge of representing the data points without running out of room on the graph due to the steep incline at the beginning. The solution is to adjust the graph to a more shallow angle to accommodate the data points effectively. The actual data points are plotted on the graph, showing the car's position at 10, 30, 60, 100, 140, 180, 220, 250, 270, 280, 288, 289, and 290 meters over 15 seconds. The paragraph concludes with a visual representation of the motion diagram, highlighting the phases of acceleration, constant speed, and deceleration. The concept of motion diagrams is emphasized as a tool for visualizing and understanding motion in physics problems.
Mindmap
Keywords
💡motion diagrams
💡accelerating
💡decelerating
💡displacement
💡position
💡delta x
💡stop light
💡graph
💡time intervals
💡office hours
💡kinematics
Highlights
Professor Anderson introduces the concept of motion diagrams to visualize car acceleration and deceleration.
The car accelerates from a stop and then comes to rest, simulating a real-world driving scenario.
Motion diagrams are represented by a series of dots, with each dot or frame corresponding to one second.
As the car accelerates, the position increases, and the intervals between dots get larger.
When the car begins to slow down, the intervals between dots become smaller, indicating deceleration.
The motion diagram shows a pattern of increasing and then decreasing intervals, representing the car's changing speed.
Real numbers are used to plot the car's position at different seconds, starting from x equals zero.
The car's position increases in meters from 0 to 10, then to 30, 60, 100, and so on, reflecting the acceleration phase.
As the car decelerates, the position increases by smaller amounts, such as from 220 to 250, then to 270, and finally to 280 and 289.
The final position of the car is chosen to be 290 meters, representing the point where the car comes to rest.
The process of plotting x as a function of time is explained, with each second representing a data point.
The graph initially appears too steep, indicating the need to adjust the scale for a more accurate representation.
The final motion diagram is described as a series of points that can be visually connected to show the car's motion.
Motion diagrams are a tool for visualizing and understanding the physics of motion in a graphical format.
The example provided demonstrates how to apply theoretical concepts to practical scenarios, such as a car's motion.
The transcript concludes with an invitation for further clarification during office hours, encouraging student engagement.
Transcripts


5.0 / 5 (0 votes)
Thanks for rating: