The Normal Distribution and the 68-95-99.7 Rule
TLDRThis video explains the 68-95-99.7 rule of the normal distribution, using IQ scores as an example. It clarifies that 68% of observations fall within one standard deviation of the mean, 95% within two, and 99.7% within three. The video demonstrates how to apply this rule to determine the percentage of people with IQs above 100, above 145, and below 85, highlighting the rarity of extreme scores and the prevalence of scores close to the mean.
Takeaways
- 📚 The video discusses the 68-95-99.7 rule for normal distributions, which is a statistical concept that describes the distribution of data points in a normal (bell-shaped) curve.
- 📈 The rule states that in a normal distribution, approximately 68% of data points fall within one standard deviation (σ) of the mean (μ).
- 🔍 For a normal distribution, about 95% of data points are within two standard deviations of the mean, according to the 68-95-99.7 rule.
- 🌐 It is mentioned that 99.7% of data points in a normal distribution fall within three standard deviations of the mean.
- 🧠 The video uses an IQ test as an example, where the scores are approximately normally distributed with a mean of 100 and a standard deviation of 15.
- 🤔 The video aims to calculate the percentage of people with IQ scores above 100, above 145, and below 85 using the 68-95-99.7 rule.
- 📉 It is explained that about 50% of the observations are above the mean (100 in this case) and 50% are below, without the need for the rule.
- 📊 The video demonstrates how to calculate the percentage of IQ scores above 145 by considering three standard deviations from the mean.
- 📉 The video concludes that approximately 0.15% of the population has an IQ score above 145, which is a very rare occurrence.
- 📈 The video also calculates that about 16% of the test scores are below 85, using the 68-95-99.7 rule and the symmetry of the normal distribution.
- 🔑 The takeaway is that knowing the mean, standard deviation, and the 68-95-99.7 rule can provide valuable insights into the distribution of scores or data points in a normal distribution.
Q & A
What is the 68-95-99.7 rule in the context of normal distribution?
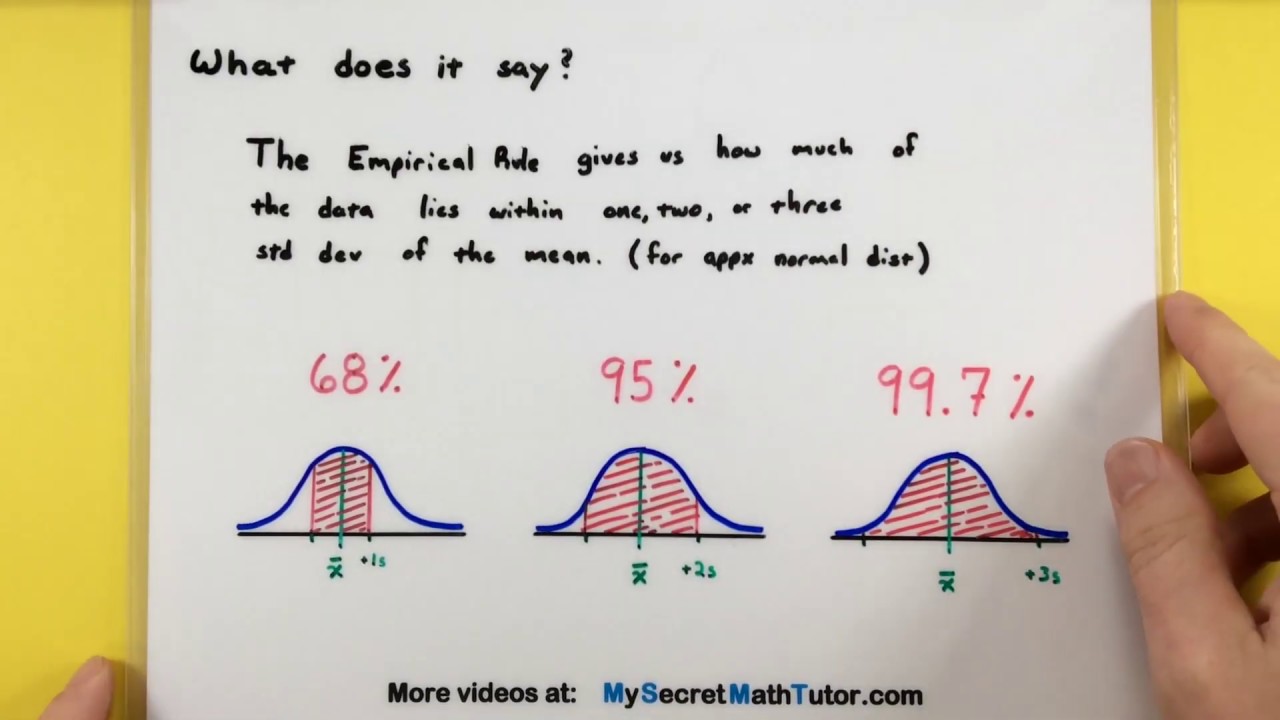
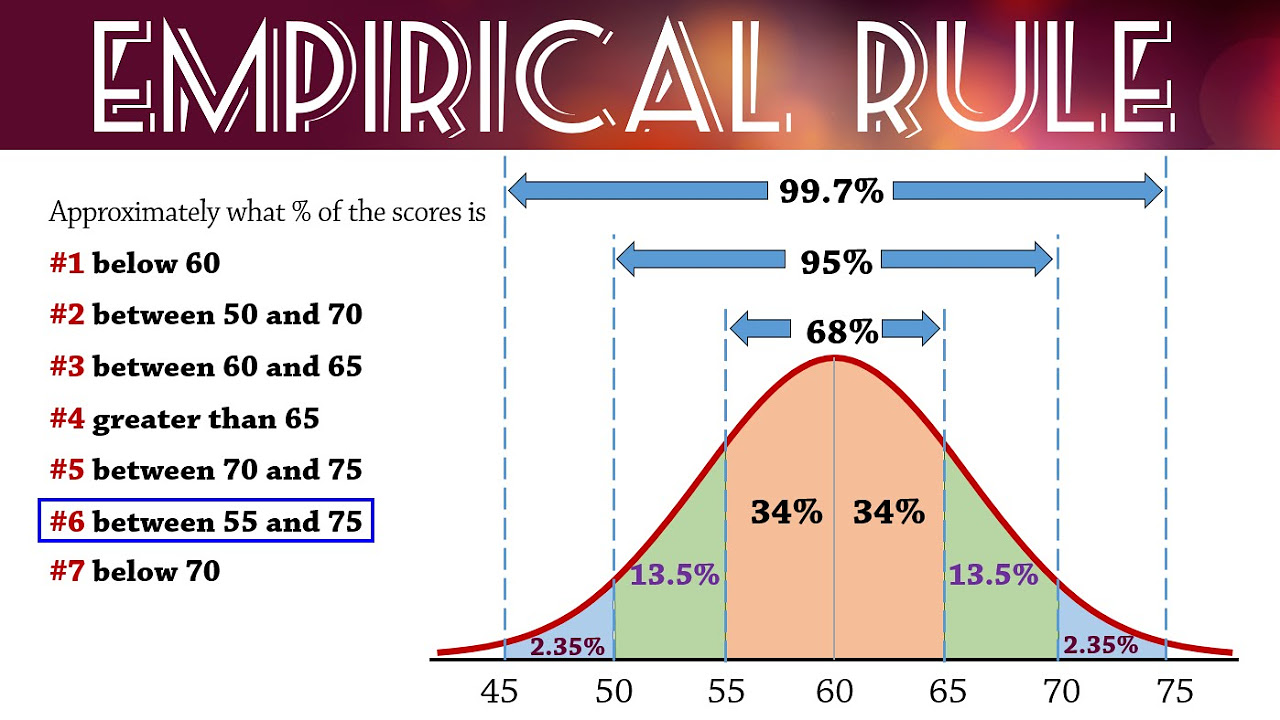
-The 68-95-99.7 rule, also known as the empirical rule, states that for a normal distribution, approximately 68% of the data falls within one standard deviation (σ) of the mean (μ), 95% within two standard deviations, and 99.7% within three standard deviations.
What is the significance of the mean (μ) in a normal distribution?
-The mean (μ) is the central value in a normal distribution, and it represents the average value of the data set. Half of the data is expected to be above the mean, and the other half below it.
What is the significance of the standard deviation (σ) in a normal distribution?
-The standard deviation (σ) measures the amount of variation or dispersion in a set of values. In a normal distribution, it indicates how spread out the data is around the mean.
How is the normal distribution of IQ scores used in the video script?
-The video script uses the normal distribution of IQ scores, which are approximately normally distributed with a mean of 100 and a standard deviation of 15, to apply the 68-95-99.7 rule and determine the percentage of people with IQ scores above 100, above 145, and below 85.
What percentage of people have an IQ score above 100 according to the script?
-Approximately 50% of people have an IQ score above 100, as half of the observations are expected to be above the mean in a normal distribution.
What percentage of IQ scores are between 85 and 115?
-Approximately 68% of IQ scores are between 85 and 115, which is within one standard deviation of the mean (100).
What percentage of IQ scores are between 70 and 130?
-Approximately 95% of IQ scores are between 70 and 130, which is within two standard deviations of the mean (100).
What percentage of IQ scores are above 145?
-Approximately 0.15% of the population has an IQ score above 145, which is more than three standard deviations above the mean.
What percentage of IQ scores are below 85?
-Approximately 16% of the test scores are below 85, which is outside one standard deviation below the mean.
How can the 68-95-99.7 rule be used to understand the distribution of a set of data?
-The 68-95-99.7 rule can be used to estimate the proportion of data that falls within certain intervals around the mean in a normal distribution. It helps to understand the spread and concentration of data points relative to the mean and standard deviation.
What is the practical application of knowing the percentage of IQ scores above certain thresholds?
-Knowing the percentage of IQ scores above certain thresholds can help in understanding the rarity or commonality of high or low IQ scores, which can be useful in various fields such as education, psychology, and human resources for talent identification and development.
Outlines
📊 Introduction to the 68-95-99.7 Rule
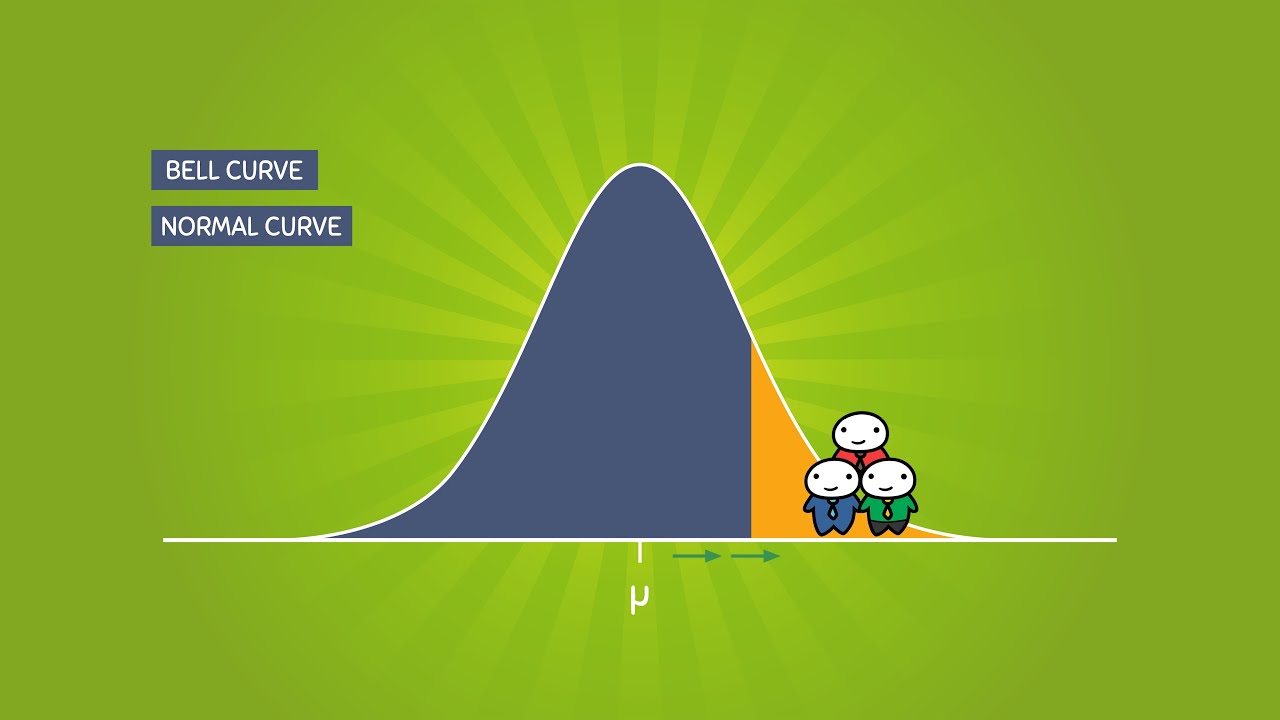
This paragraph introduces the concept of the 68-95-99.7 rule in the context of the normal distribution, also known as the bell curve. It explains that for a normal distribution with a mean (mu) and a standard deviation (Sigma), approximately 68% of observations fall within one standard deviation of the mean, 95% within two standard deviations, and 99.7% within three standard deviations. The paragraph uses the example of an IQ test, which is normally distributed with a mean of 100 and a standard deviation of 15, to illustrate how the rule can be applied to determine the percentage of people scoring above or below certain IQ levels.
🧠 Applying the Rule to IQ Scores
The second paragraph delves into applying the 68-95-99.7 rule to the distribution of IQ scores. It explains how to calculate the percentage of people scoring above 100, above 145, and below 85 using the rule. The explanation includes the process of adding and subtracting the standard deviation from the mean to find the intervals within which the specified percentages of the population fall. The paragraph also provides a visual representation of the normal distribution curve and discusses the symmetry of the distribution, highlighting that 50% of the observations are above the mean and 50% are below. It concludes with the calculation that 0.15% of the population has an IQ score above 145 and that 16% of scores are below 85 or above 115, emphasizing the rarity of extreme IQ scores.
Mindmap
Keywords
💡Normal Distribution
💡68-95-99.7 Rule
💡Mean (mu)
💡Standard Deviation (Sigma)
💡IQ Test
💡Observations
💡Symmetry
💡Percentile
💡Tail
💡Deviation
💡Statistical Significance
Highlights
Introduction to the normal distribution and the 68-95-99.7 rule.
Explanation of the 68-95-99.7 rule for normal distributions, relating to the mean (μ) and standard deviation (σ).
68% of observations fall within one standard deviation of the mean in a normal distribution.
95% of observations fall within two standard deviations of the mean.
99.7% of observations fall within three standard deviations of the mean.
Application of the rule using IQ test scores as an example, with a mean of 100 and a standard deviation of 15.
50% of people have IQ scores above 100 due to the symmetry of the normal distribution.
Calculating the percentage of people with IQ scores above 145 using the 68-95-99.7 rule.
Approximately 0.15% of the population has an IQ score above 145.
16% of test scores are below 85, outside one standard deviation from the mean.
16% of test scores are above 115, outside one standard deviation from the mean.
Demonstration of the normal distribution curve with the mean at 100 and standard deviation of 15.
The importance of knowing the mean, standard deviation, and the 68-95-99.7 rule for understanding score distributions.
The rule's practical application in estimating the percentage of scores within specific ranges.
Visual representation of the normal distribution curve with the calculated ranges for one, two, and three standard deviations.
Explanation of how the tails of the normal distribution represent the rarest scores.
The significance of the 68-95-99.7 rule in understanding the spread of data in a normal distribution.
Final summary of the 68-95-99.7 rule's utility in estimating the distribution of IQ scores.
Transcripts
Browse More Related Video

What is a Bell Curve or Normal Curve Explained?
Statistics - How to use the Empirical Rule

Empirical Rule of Standard Deviation in Statistics
The Normal Distribution and the 68-95-99.7 Rule (5.2)
Empirical Rule (68-95-99.7) for Normal Distributions

k12.org exercise: Standard normal distribution and the empirical | Khan Academy
5.0 / 5 (0 votes)
Thanks for rating: