k12.org exercise: Standard normal distribution and the empirical | Khan Academy
TLDRThis video script from ck12.org's AP Statistics FlexBook covers problem number 4, which involves ordering elements of a standard normal distribution. The presenter explains how to use the empirical rule (68-95-99.7 rule) to estimate percentages of data below certain z-scores, such as 1 and -1, and identifies the mean and standard deviation of the distribution. The script concludes with ordering the calculated values, clarifying potential ambiguity between percentages and their decimal equivalents.
Takeaways
- 📚 The video discusses problem number 4 from the Normal Distribution chapter of an AP Statistics FlexBook available for free on ck12.org.
- 📈 The script explains how to order different values from a standard normal distribution (mean = 0, standard deviation = 1) from smallest to largest.
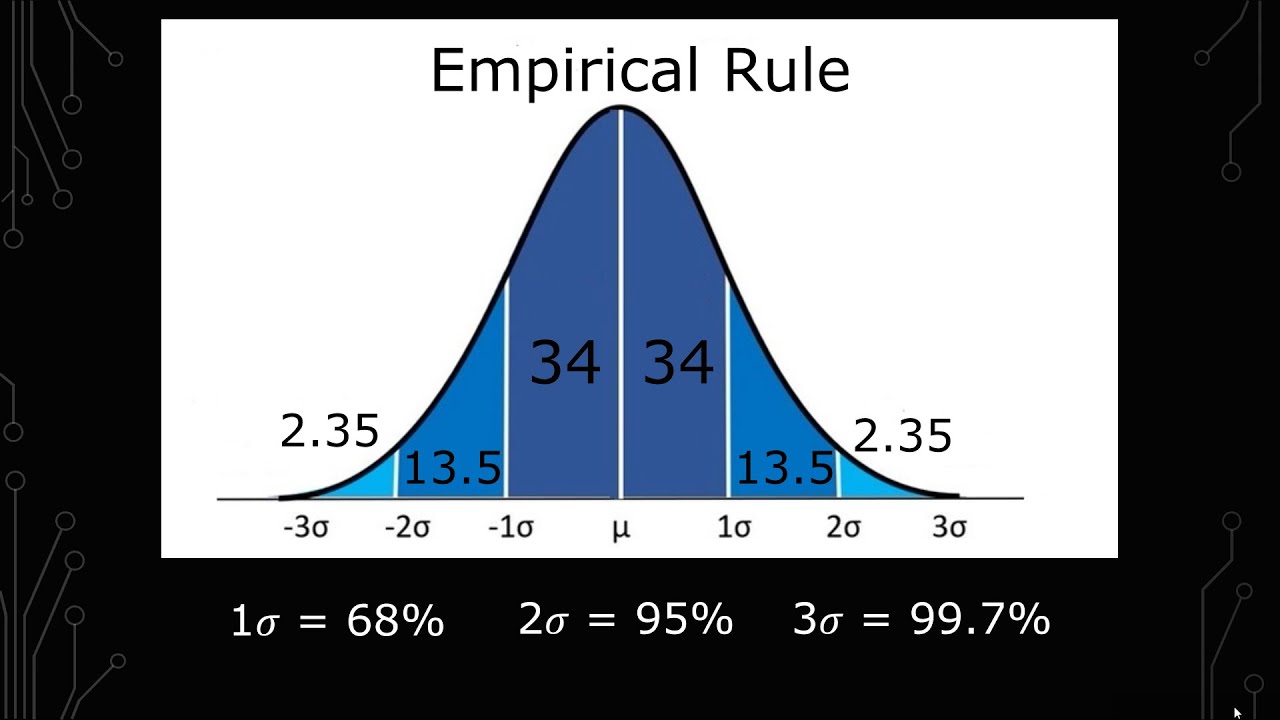
- 📊 A standard normal distribution is characterized by a bell curve with the mean at 0 and a standard deviation of 1, dividing the curve into symmetrical halves.
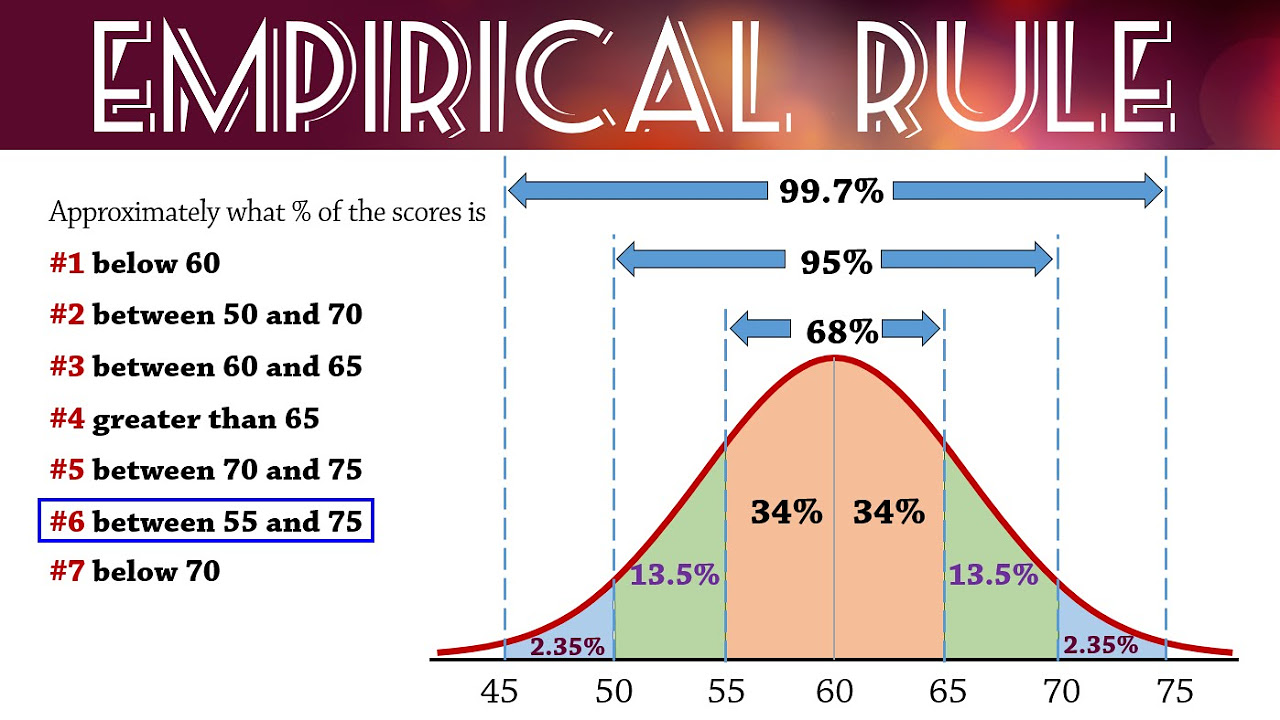
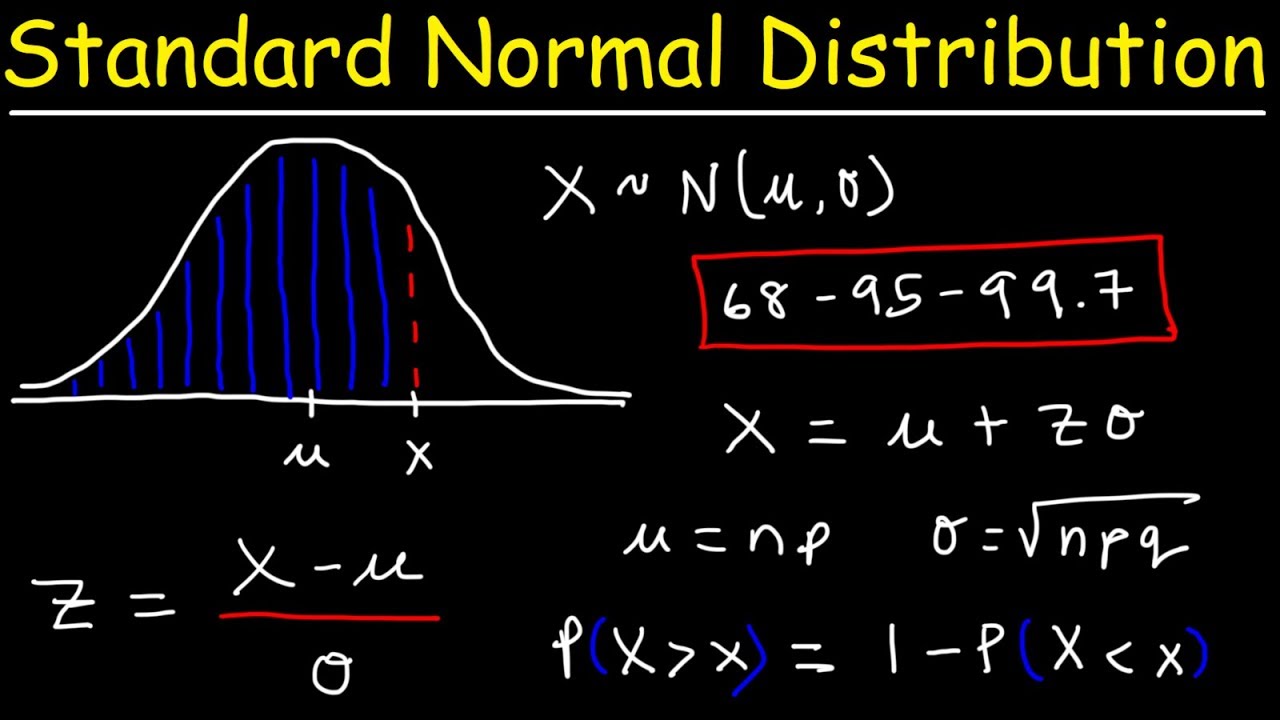
- 🔢 The empirical rule, also known as the 68-95-99.7 rule, is introduced as a method to estimate percentages of data within certain standard deviations from the mean.
- 🧠 The empirical rule states that approximately 68% of data falls within one standard deviation of the mean, 95% within two standard deviations, and 99.7% within three standard deviations.
- 📉 The script calculates the percentage of data below 1 as 84% using the empirical rule, which includes the area within one standard deviation (68%) plus the left tail (16%).
- 📌 The percentage of data below -1 is given as 16%, which corresponds to the left tail of the distribution.
- 🎯 The mean of a standard normal distribution is defined as 0, and the standard deviation is 1, which are straightforward values in this context.
- 📊 The percentage of data above 2 is calculated to be 2.5%, derived from the empirical rule by subtracting the 95% within two standard deviations from 100%.
- 🔄 The script highlights the importance of understanding the difference between percentages and their decimal equivalents when ordering values.
- 📝 The final ordering of the values, considering their decimal equivalents, is c (0), e (0.025), b (0.16), a (0.84), and d (1), with a note on potential ambiguity in interpreting the question.
Q & A
What is the source of the problem discussed in the script?
-The problem discussed in the script is from the Normal Distribution chapter of the AP Statistics FlexBook on ck12.org.
What does the speaker suggest to do with the problem?
-The speaker suggests practicing the problem, which involves ordering various percentages and values related to a standard normal distribution.
What is a standard normal distribution?
-A standard normal distribution is a normal distribution with a mean (mu) of 0 and a standard deviation of 1.
What is the empirical rule, also known as the 68-95-99.7 rule?
-The empirical rule states that for a standard normal distribution, approximately 68% of the data falls within one standard deviation of the mean, 95% within two standard deviations, and 99.7% within three standard deviations.
How much of the data is below the value of 1 in a standard normal distribution according to the empirical rule?
-According to the empirical rule, 84% of the data is below the value of 1 in a standard normal distribution.
What percentage of the data is below the value of -1 in a standard normal distribution?
-16% of the data is below the value of -1 in a standard normal distribution.
What is the mean of a standard normal distribution?
-The mean of a standard normal distribution is 0 by definition.
What is the standard deviation of a standard normal distribution?
-The standard deviation of a standard normal distribution is 1 by definition.
What percentage of the data is above the value of 2 in a standard normal distribution?
-2.5% of the data is above the value of 2 in a standard normal distribution.
How should one interpret the percentages given in the problem when ordering them from smallest to largest?
-One should interpret the percentages as decimals when ordering them from smallest to largest, as the ambiguity arises from whether to consider the percentage value or the fraction of data.
What is the correct order of the values from smallest to largest based on the script?
-The correct order, considering the values as decimals, is c (0), e (0.025), b (0.16), a (0.84), and d (1).
Outlines
📚 Understanding the Standard Normal Distribution
This paragraph introduces problem number 4 from the AP Statistics chapter on the Normal Distribution found on ck12.org's FlexBook. The speaker encourages visiting the site to download the material for free. The problem involves ordering various elements related to a standard normal distribution from smallest to largest. The speaker explains the characteristics of a standard normal distribution, where the mean (mu) is 0 and the standard deviation is 1. A visual representation of the bell curve is described, illustrating the mean and standard deviations. The empirical rule, also known as the 68-95-99.7 rule, is introduced as a tool for estimating percentages of data within certain intervals around the mean. Using this rule, the speaker calculates the percentage of data below 1 and below -1, identifying these as 84% and 16% respectively. The mean and standard deviation of the standard normal distribution are also stated as 0 and 1, completing the ordering task.
📉 Applying the Empirical Rule to Order Data Percentages
The second paragraph continues the discussion on the standard normal distribution, focusing on the application of the empirical rule to determine the percentage of data above 2 standard deviations from the mean. The speaker uses the 68-95-99.7 rule to deduce that 95% of the data lies within 2 standard deviations of the mean, leaving 5% in the tails. The symmetry of the normal distribution is highlighted to conclude that 2.5% of the data is above 2 standard deviations. The paragraph then addresses the ambiguity in the ordering task, whether to use percentages or their decimal equivalents. The speaker opts for the decimal interpretation, ordering the elements as follows: the mean (0), the percentage of data above 2 standard deviations (0.025), the percentage of data below -1 (0.16), the percentage of data below 1 (0.84), and finally the standard deviation (1). The speaker suggests clarifying such ambiguities with a teacher if encountered in an exam setting.
Mindmap
Keywords
💡Normal Distribution
💡Empirical Rule
💡Standard Deviation
💡Mean
💡Percentage of Data
💡Symmetric
💡Bell Curve
💡AP Statistics
💡Ordering Data
💡Fraction of Data
💡Estimate
Highlights
Introduction to problem number 4 from the Normal Distribution chapter on AP Statistics.
Mention of ck12.org's FlexBook as a free resource for AP Statistics.
Explanation of the standard normal distribution with mean (mu) equal to 0 and standard deviation equal to 1.
Illustration of the standard normal distribution curve and its characteristics.
Use of the empirical rule (68, 95, 99.7 rule) to estimate percentages in a normal distribution.
Calculation of the percentage of data below 1 in a standard normal distribution as 84%.
Determination that the percentage of data below -1 is 16% using the empirical rule.
Identification of the mean of a standard normal distribution as 0 by definition.
Clarification that the standard deviation of a standard normal distribution is 1 by definition.
Application of the empirical rule to find the percentage of data above 2 as 2.5%.
Discussion on the ambiguity of interpreting percentages versus fractions in the context of the problem.
Ordering the calculated values from smallest to largest based on decimal representation.
Final ordering of the values: c (mean), e (above 2), b (below -1), a (below 1), d (standard deviation).
Advice on clarifying ambiguous questions with a teacher or exam proctor.
Emphasis on the importance of practice with the empirical rule for estimating percentages.
Highlight of the practical application of the standard normal distribution in statistics.
Transcripts
Browse More Related Video

ck12.org normal distribution problems: Empirical rule | Probability and Statistics | Khan Academy
Empirical Rule (68-95-99.7) for Normal Distributions
How to Use the Empirical Rule with Examples
ck12.org normal distribution problems: z-score | Probability and Statistics | Khan Academy
Standard Normal Distribution Tables, Z Scores, Probability & Empirical Rule - Stats

Elementary Statistics - Chapter 6 Normal Probability Distributions Part 1
5.0 / 5 (0 votes)
Thanks for rating: