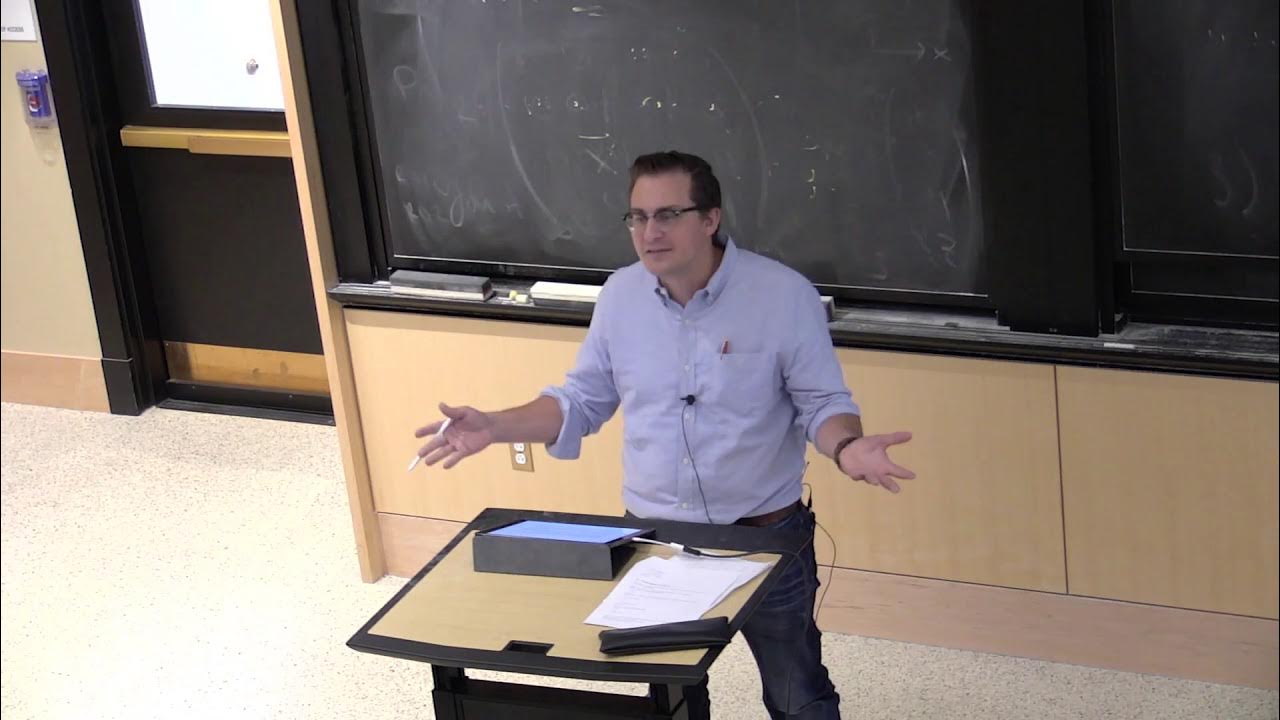
Statistician Answers Stats Questions From Twitter | Tech Support | WIRED
TLDRIn this informative discussion, Professor Jeffrey Rosenthal of the University of Toronto addresses common misconceptions about probability and the importance of statistics in interpreting data accurately. He debunks the myth of the 50/50 chance in unlikely events, emphasizes the value of statistical analysis in discerning trends from data, and explains the challenges in polling accuracy. Rosenthal also explores statistical errors, the concept of stochastic processes, and the meaning of statistical significance, providing insights into the complexities and applications of statistics in everyday life.
Takeaways
- 🧐 The principle of indifference suggests assigning equal probabilities to all possible outcomes, but this isn't always accurate in real-world scenarios.
- 📊 Statistics is crucial in interpreting the vast amount of data we encounter daily, from disease spread to financial trends, and helps discern factual trends from misconceptions.
- 📈 Despite some high-profile misses, election polls are generally quite accurate, with errors usually within 4-5% of actual outcomes.
- 🔄 The challenge in polling lies in obtaining a truly random sample, as low response rates can introduce significant biases.
- 🚗 A common statistical error is not considering the 'out of how many' principle, which involves looking at the probability of an event occurring to someone, rather than in a specific manner to a specific individual.
- ⚖️ A statistically significant result implies that the observed effect is unlikely to be due to chance alone, indicating a real difference or occurrence.
- 🎰 The odds of winning a lottery jackpot are astronomically low, making almost any other event more likely than winning the lottery.
- 🔄 Data can be skewed in various ways, but this doesn't invalidate statistics; instead, it calls for careful consideration of data collection methods and potential biases.
- 🎲 In games like roulette, the odds are structured to slightly favor the casino, leading to long-term losses for players despite short-term wins.
- 🎯 The concept of stochastic processes involves random events occurring over time, and they can be used to model a wide range of phenomena.
- 🤔 The P value in statistics helps determine the likelihood that an observed outcome is due to chance rather than a true effect, with lower values indicating stronger evidence against the null hypothesis.
Q & A
Why do statisticians disagree with the notion that every event is a 50/50 chance?
-Statisticians disagree because many events have probabilities that are not equal to 50%. The principle of indifference suggests that without prior information, all outcomes seem equally likely, but in reality, events have different probabilities based on available data and context.
What is the importance of statistics in our daily lives?
-Statistics is crucial in interpreting the vast amount of data we encounter daily, such as disease spread, crime rates, medical treatments, financial trends, and public opinion. It helps us discern real trends from misconceptions and makes informed decisions based on factual analysis rather than anecdotal evidence or assumptions.
Why do election polls sometimes yield incorrect results?
-Election polls can be inaccurate due to challenges in obtaining a truly random sample, as most people are unwilling to participate in polls. Low response rates can introduce biases, affecting the representativeness of the sample and, consequently, the poll's accuracy.
What are common statistical errors and how can we identify them?
-One common error is not considering the 'out of how many' principle, which involves focusing on the probability of an event happening to a specific individual rather than the probability of it happening to someone in a larger population. This can lead to misinterpretations, such as wrongful accusations in rare events like SIDS cases.
What is more likely than winning the lottery?
-Almost any everyday event is more likely than winning the lottery. For instance, being killed by lightning or the next person you meet becoming the president is more probable than winning a major lottery jackpot, which has odds in the range of hundreds of millions to one.
How do video lottery terminals compare with other casino games in terms of odds?
-Video lottery terminals typically have some of the worst odds for players, with a house edge of around 5% to 15%. In contrast, games like Craps offer better odds, with a 49.2929% chance of winning when betting on red.
Are murder rates actually increasing, or is it just media focus?
-While murder rates have seen a slight uptick in recent years, they are still significantly lower than they were a decade or two ago. Media focus can amplify the perception of crime rates, but actual statistics should be consulted for accurate information.
How does probability work in roulette?
-In American Roulette, there are 38 slots: 18 black, 18 red, and 2 green (zero and double zero). The probability of the ball landing on any given color is 18/38 or approximately 47.1% for red or black, and 1/38 or 2.6% for green. This gives the casino a slight edge, making long-term play unfavorable for the player.
Who determines betting odds and how?
-Bookies or oddsmakers determine betting odds, aiming to balance bets on both sides to ensure profitability regardless of the outcome. Traditionally, this was done through judgment and experience, but modern online gambling often relies on algorithms that adjust odds based on real-time betting patterns.
What is a stochastic process?
-A stochastic process is a system or model that evolves randomly over time. It involves a sequence of random variables where the outcome of each step depends on the previous ones. A simple example is a frog moving randomly left or right at each second, which will eventually cover all possible locations with a probability of one.
What does 'statistically significant' mean?
-Statistical significance indicates that an observed effect or difference is unlikely to be due to chance alone. It suggests that there is a high probability (usually above the 5% threshold) that the observed result reflects a genuine phenomenon rather than random variation.
How can a statistician explain P-values to a non-statistician?
-A statistician can explain P-values as the probability that the observed results would occur by pure chance if there were no true effect. A low P-value (typically below 5%) suggests that the observed effect is unlikely to be due to chance, providing evidence that the effect is real.
What are the odds of three generations of a family being born on the same day?
-The odds are quite low, calculated as one in 365 for the first person, one in 365 for the second, and one in 365 for the third, resulting in approximately one in 100,000. However, considering all possible combinations within a larger family can increase the probability.
Outlines
🎲 Misconceptions and Importance of Statistics
Jeffrey Rosenthal addresses common misunderstandings about probability, emphasizing its importance beyond a simplistic 50/50 view. He stresses the role of statistics in making sense of data across various fields, such as disease spread, crime rates, and public opinion, helping to discern truth from misinformation. The segment also tackles the challenges in election polling, including the small margins of error and the difficulties in obtaining a truly random sample. Rosenthal highlights common statistical errors, such as failing to consider the broader context of probabilities, and the critical need for statistical literacy to understand and correct these misconceptions.
📊 Navigating Data and Probability in Everyday Life
The dialogue continues with discussions on the improbability of winning the lottery compared to everyday risks, addressing skepticism towards statistics due to potential biases in data. Rosenthal points out that despite data imperfections, statistics remains crucial for informed decision-making. He dispels myths around casino games, revealing which have the worst odds for players, and explains how murder rates have evolved, cautioning against misleading representations in media. The complexity of setting betting odds and the essence of stochastic processes are demystified, highlighting the unpredictable nature of random events and their study.
🔍 Statistical Significance and Unusual Probabilities
Rosenthal delves into the concept of statistical significance, illustrating how it helps determine if observations likely reflect true effects rather than chance. He explores the improbability of shared birthdays in a family across generations, offering perspective on interpreting such odds. The segment covers the P value's role in evaluating the effectiveness of treatments, concluding with an analysis of a surprising sequence in lottery numbers, and debunking the myth that surviving a plane crash affects one's odds of experiencing another. The discussion broadens understanding of probability and the critical thinking needed to interpret statistical information.
🤔 Reflections on Probability and Personal Encounters
The script concludes with Rosenthal sharing a personal anecdote about unexpectedly meeting a relative at Disney World, using it to illustrate the nuances of probability in everyday life. He calculates the odds of such encounters, demonstrating that seemingly improbable events are more common than one might think. This story serves as a metaphor for the broader theme of the video: understanding and appreciating the complexities of statistics and probability can illuminate the surprising patterns of our world and guide us towards more rational, informed decisions.
Mindmap
Keywords
💡Probability
💡Statistical Significance
💡Polls
💡Margin of Error
💡Random Sample
💡Bias
💡Data Collection
💡Statistical Errors
💡P Value
💡Stochastic Process
Highlights
Statisticians often face misconceptions about probability, such as the belief that all possible outcomes are equally likely (50/50).
The principle of indifference suggests assigning equal probabilities to all possible outcomes, but real-world events often defy this simplistic assumption.
Statistics is crucial in interpreting the vast array of data we encounter, from disease spread to financial trends, and helps discern fact from hearsay.
Public opinion polls, while not infallible, offer valuable insights; high-profile misses, like in the 2016 and 2020 US elections, have prompted reflection on methodology.
The challenge in polling lies in obtaining a truly random sample; low response rates and self-selection bias can skew results significantly.
Common statistical errors include not considering the 'out of how many' principle, which overlooks the broader context of probability.
The case of the English mother accused of harming her children due to two SIDS cases illustrates the danger of misinterpreting statistical probabilities.
Statistical analysis can reveal the likelihood of events that seem improbable, such as being struck by lightning or meeting the next US president.
Data can be skewed in numerous ways, emphasizing the importance of careful examination and interpretation in statistical analysis.
Understanding the odds in casino games, like the poor house odds in video lottery terminals, can inform better decision-making for players.
Murder rates have generally decreased over the past decades, though recent slight increases have fueled media focus and public concern.
The roulette wheel exemplifies probability in action, with the casino always holding a slight edge due to the wheel's design.
Betting odds are often adjusted in real-time to balance bets, with modern bookies using algorithms to respond to betting patterns.
Stochastic processes, or random processes, are at the heart of many mathematical studies, including the surprising predictability of a frog's random movements.
Statistical significance helps determine whether observed effects are likely due to chance or reflect a genuine phenomenon.
The concept of P value is key in statistical testing, offering a measure of the probability that observed results occur by chance alone.
The odds of three generations of a family sharing the same birthday are incredibly slim, but the multitude of possible combinations makes such coincidences more likely than perceived.
Explaining P value to non-statisticians involves clarifying the probability that observed outcomes are due to random chance rather than a true effect.
Statistical improbability does not apply to subsequent events; for instance, being in a plane crash once does not affect the likelihood of a second crash.
The unexpected encounter with a known individual in a large crowd, like at Disney World, is less improbable than it seems when considering the broader context.
Transcripts
5.0 / 5 (0 votes)
Thanks for rating:


