Independent Sample t-Test in SPSS Tutorial (SPSS Tutorial Video #13) - Comparing Two Groups
TLDRIn this 'Data Demystified' tutorial, Jeff Gallick guides viewers through conducting and interpreting an independent sample t-test in SPSS. He uses a survey dataset to compare the average opinion of YouTube across genders, highlighting the importance of variance equality. The tutorial demonstrates how to set up the test, interpret the output, and report results, including the significance of p-values and mean differences. Gallick also invites viewers to practice the analysis themselves and emphasizes the importance of understanding statistical intuition for effective data analysis.
Takeaways
- 📚 The video is a tutorial on using SPSS for conducting and interpreting an independent sample t-test.
- 🔍 The tutorial focuses on comparing the means of one variable across two groups of data.
- 📈 The example data used is from a 'YouTube Viewing Habits Survey', which can be found via a link provided in the video description.
- 👤 The average opinion variable, calculated from responses about preferences towards YouTube, is used for demonstration.
- 👨👩 The gender variable, coded as 1 for male, 2 for female, and 3 for other, is used for grouping the data in the t-test.
- 🚫 Independent sample t-tests are limited to comparing only two groups, unlike ANOVA which can compare multiple groups.
- 📊 To run the t-test in SPSS, one must select the test variable, define the grouping variable, and specify the groups for comparison.
- 📉 The Levene's test is used to check for equality of variances between the two groups, which is an assumption of the t-test.
- 🔢 If variances are unequal, the t-test result with 'equal variance not assumed' is considered, as indicated by the p-value.
- 📝 The result of the t-test includes the t-statistic, degrees of freedom, p-value, and the mean difference with a 95% confidence interval.
- 🔄 The tutorial encourages viewers to pause the video and try the analysis themselves, specifically comparing age across genders.
Q & A
What is the main topic of the 'Data Demystified' video series?
-The main topic of the 'Data Demystified' video series is teaching viewers how to use SPSS for data analysis, with a focus on different statistical tests and interpretations.
What is the specific statistical test covered in the provided video script?
-The specific statistical test covered in the video script is the independent sample t-test, which is used to compare the means of one variable across two groups of data.
What is the dataset used in the video for demonstration purposes?
-The dataset used in the video is the 'YouTube Viewing Habits Survey' created by Jeff Gallick, which is available for viewers to find in the video description.
What is the variable 'average opinion' and how was it calculated?
-The 'average opinion' is a variable that represents the average response across a series of questions asking about people's preferences towards YouTube. It was calculated in a previous video, as mentioned by Jeff Gallick.
How is gender coded in the dataset used in the video?
-In the dataset, gender is coded numerically with 1 for male, 2 for female, and 3 for other.
Why is it important to remember the coding of male and female in the dataset?
-It is important to remember the coding because it is necessary for correctly setting up the independent sample t-test to compare the means between two specific groups, in this case, male versus female.
What is the limitation of the independent sample t-test when it comes to comparing groups?
-The independent sample t-test is limited to comparing only two groups at a time. For comparing more than two groups, other analyses like ANOVA are used.
What does the 'Define Groups' option in SPSS allow the user to do during a t-test?
-The 'Define Groups' option in SPSS allows the user to specify which groups to compare. It is necessary because SPSS does not inherently know which groups the user wants to compare, such as group 1 versus group 2.
What does the output of the t-test in SPSS provide and how is it interpreted?
-The output provides group statistics, including the number of individuals in each group, the mean response, and standard deviation. It also includes the test statistic, degrees of freedom, and p-value. The interpretation involves checking if the p-value is below the significance level (commonly 0.05) to determine if the means of the two groups are significantly different.
What does the script suggest doing with the 'age' variable in a follow-up exercise?
-The script suggests using the 'age' variable to perform a similar independent sample t-test analysis to see if there is a significant difference in age between males and females.
What is the significance of the Levene's test mentioned in the script?
-The Levene's test is used to check the assumption of equal variances between the two groups being compared in a t-test. If the test is significant, it indicates that the variances are not equal, and the results from the row assuming equal variances should not be used.
What is the conclusion drawn from the t-test comparing the 'average opinion' of males and females?
-The conclusion is that there is a significant difference between the 'average opinion' of males (5.61) and females (5.75) towards YouTube, as the p-value of 0.043 is below the significance level of 0.05.
What is the result of the t-test comparing the 'age' of males and females, and what does it imply?
-The result of the t-test for 'age' shows a p-value of 0.246, which is above the significance level of 0.05. This implies that there is no significant difference in the age between males and females based on the data provided.
What additional resources does Jeff Gallick offer to help viewers understand the intuition behind statistical analysis?
-Jeff Gallick offers other intuition-focused videos on the channel that aim to demystify statistics and data science, providing a deep intuitive understanding behind the analyses performed.
Outlines
📊 Conducting an Independent Sample T-Test in SPSS
In this tutorial, Jeff Gallick introduces viewers to performing an independent sample t-test in SPSS to compare the means of a variable across two groups. The example uses a survey about YouTube viewing habits, focusing on the 'average opinion' variable, which is the mean opinion across several questions regarding preferences for YouTube. Gender, coded as 1 for male, 2 for female, and 3 for other, serves as the grouping variable, with the 'other' category being excluded from the analysis. Jeff explains the importance of t-tests being limited to two groups and demonstrates how to set up the t-test in SPSS, including defining the groups for comparison. He also covers the interpretation of the output, noting the significance of the Levene's test for equality of variances and how to report the results if the variances are not equal.
🔍 Comparing Age Across Genders Using T-Test
Continuing the tutorial, Jeff Gallick demonstrates how to use an independent sample t-test to compare the average age of males and females from the same survey data. He resets the SPSS analysis to include 'age' as the test variable and 'gender' as the grouping variable, defining the groups as 1 (male) versus 2 (female). The analysis reveals that males have a slightly higher average age than females, but the t-test shows no significant difference in age between the two groups, as indicated by a p-value above the 0.05 threshold. Jeff concludes by emphasizing the utility of t-tests for comparing averages across two groups and mentions the coverage of ANOVA for multiple groups in future videos. He also invites viewers to engage with the content by pausing the video to try the analysis themselves and to subscribe for more educational content on statistics and data science.
Mindmap
Keywords
💡Independent Sample T-Test
💡Means
💡YouTube Viewing Habits Survey
💡Variable
💡Gender
💡Grouping Variable
💡Levene's Test
💡Significance Level
💡T-Statistic
💡Degrees of Freedom
💡Confidence Interval
💡ANOVA
Highlights
Introduction to the tutorial series on using SPSS for data analysis by Jeff Gallick.
Explanation of how to conduct and interpret an independent sample t-test in SPSS.
Use of the YouTube Viewing Habits Survey as a dataset for demonstration purposes.
Comparison of the average response to a question across two different groups using t-test.
Demonstration of calculating the average opinion variable from a series of questions.
Clarification on gender coding in the dataset: 1 for male, 2 for female, and 3 for other.
Limitation of t-tests to comparing only two groups, unlike ANOVA which can compare multiple groups.
Step-by-step guide on how to run an independent sample t-test in SPSS.
Importance of defining groups for comparison in t-tests and the irrelevance of order.
Interpretation of the output from the t-test, including group statistics and mean responses.
Explanation of Levene's test for equality of variances and its implications for t-test results.
Significance of the t-statistic and p-value in determining if group means are different.
Reporting the results of a t-test, including the mean difference and its confidence interval.
Invitation for viewers to pause the video and try the analysis themselves with age as a variable.
Demonstration of comparing age across genders and the interpretation of the t-test results.
Conclusion that the ages of males and females are not statistically different based on the data.
Teaser for future videos on ANOVA for comparing means across multiple groups.
Call to action for viewers to like, subscribe, and enable notifications for new content.
Jeff Gallick's mission to equip individuals with the knowledge to thrive in a data-rich world.
Promotion of intuition-focused videos that demystify statistics and data science.
Transcripts
Browse More Related Video
Three Different t tests using SPSS with Dr Ami Gates
Permutation Hypothesis Test in R with Examples | R Tutorial 4.6 | MarinStatsLectures
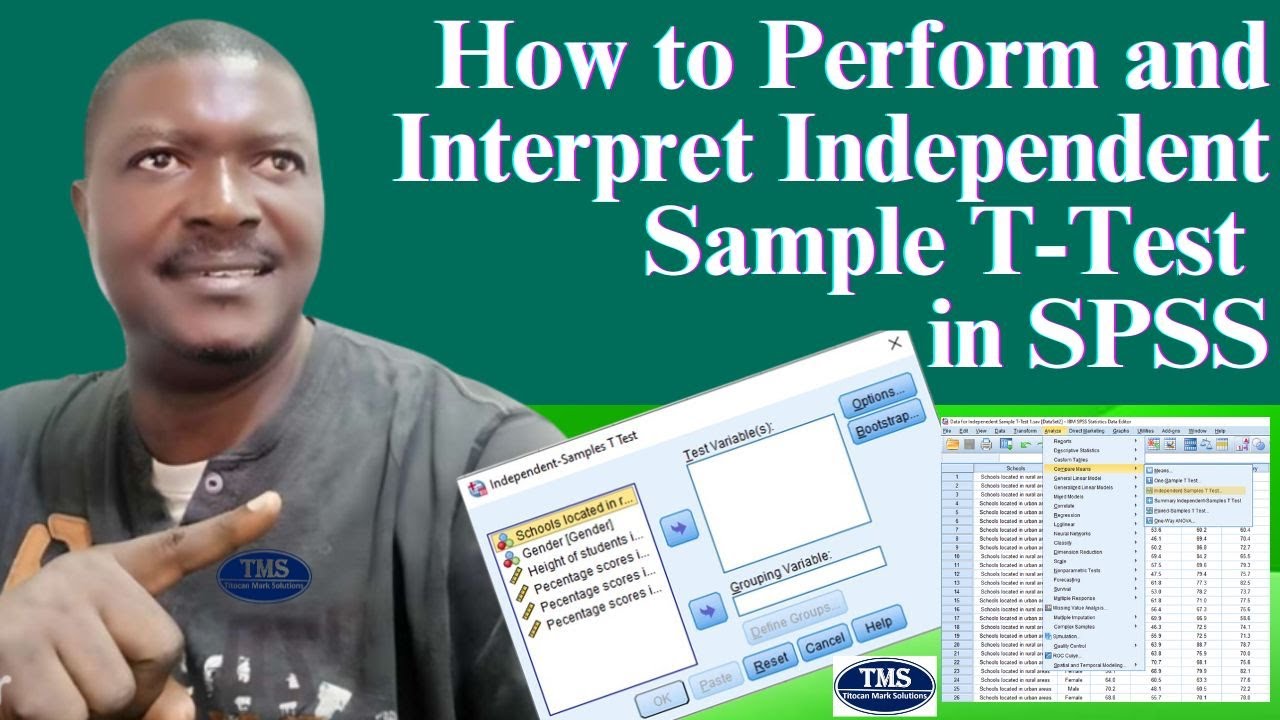
How to Perform and Interpret Independent Sample T-Test in SPSS
One-Way ANOVA with LSD (Least Significant Difference) Post Hoc Test in Excel
Pretest and Posttest Analysis with ANCOVA and Repeated Measures ANOVA using SPSS

Significance vs. Effect Size for One Way ANOVA using SPSS
5.0 / 5 (0 votes)
Thanks for rating: