How to Perform and Interpret Independent Sample T-Test in SPSS
TLDRThis educational video by Tian from Tito ma Solutions introduces viewers to the independent sample T Test in SPSS. It explains the test's purpose, assumptions, and how to set up and interpret the analysis comparing means of two independent groups. The video uses a dataset comparing the height and academic scores of male and female students to demonstrate the process, highlighting the importance of hypothesis testing and the significance of results in statistical analysis.
Takeaways
- 📚 The video is part of a series on T Test analysis, focusing on demonstrating and interpreting the Independent Sample T Test in SPSS.
- 🔍 The Independent Sample T Test is used to compare the means of two independent groups to determine if there is statistical evidence of a significant difference between them.
- 👥 It's essential to measure each group separately, such as males and females, and then compare their mean values to see if there's a statistically significant difference.
- ❌ If there is a significant difference, the null hypothesis is rejected; if not, there's insufficient evidence to reject the null hypothesis.
- 📈 The test is applicable to nominal variables with only two levels, such as gender (male or female), making it a dichotomous variable.
- 🚫 The Independent Sample T Test should not be used when comparing means across more than two groups; instead, ANOVA should be used.
- 📝 The test assumes that the dependent variable is continuous, the observations are independent, there are no significant outliers, and the data is approximately normally distributed with homogeneity of variances.
- 💡 The video provides a step-by-step guide on how to perform the test in SPSS, including how to load data and interpret the results.
- 📊 The results are presented in two tables: one for group statistics and another for inferential statistics, including Levene's test for homogeneity of variances and the T test for equality of means.
- 📉 The interpretation of the results can be done in three ways: by comparing the T value to the critical value, by examining the P value, or by looking at the 95% confidence interval.
- 👍 The video encourages viewers to like, share, and subscribe for more educational content on statistical analysis in SPSS.
Q & A
What is the purpose of the Independent Sample T Test?
-The Independent Sample T Test is used to compare the means of two independent groups to determine if there is statistical evidence that the associated population means are significantly different.
What is the null hypothesis in the context of an Independent Sample T Test?
-The null hypothesis states that there is no significant difference between the two population means, implying that any observed difference is due to chance.
What is the alternative hypothesis in an Independent Sample T Test?
-The alternative hypothesis states that there is a significant difference between the two population means, suggesting that the observed difference is not due to chance.
What are the assumptions that must be met for an Independent Sample T Test to be valid?
-The assumptions include: the dependent variable being measured on a continuous scale, the independent variable consisting of two independent groups, independence of observations, no significant outliers, approximate normal distribution of the dependent variable for each group, and homogeneity of variances.
Why is it not advisable to use the Independent Sample T Test when there are more than two groups?
-The Independent Sample T Test is designed to compare the means of only two groups. For more than two groups, an ANOVA (Analysis of Variance) should be used instead.
What is the difference between a nominal variable and a dichotomous variable?
-A nominal variable is categorical without any intrinsic order or ranking, while a dichotomous variable has exactly two levels, such as male or female, head or tail.
What does it mean if the Levene's test for homogeneity of variances shows a P-value greater than 0.05?
-If the P-value of Levene's test is greater than 0.05, it indicates homogeneity of variances, meaning that the variances of the two groups are considered equal, and the results for equal variances assumed should be interpreted.
How can one interpret the results of an Independent Sample T Test using the T-value?
-The T-value is compared to a critical value from the T-distribution table. If the T-value is greater than the critical value, it suggests a significant difference between the means. If it is less, the means are not significantly different.
What is the significance of the P-value in the context of an Independent Sample T Test?
-The P-value indicates the probability of observing the data if the null hypothesis were true. If the P-value is less than the significance level (commonly 0.05), it suggests that the results are statistically significant, and the null hypothesis can be rejected.
How can the 95% confidence interval be used to interpret the results of an Independent Sample T Test?
-If the 95% confidence interval for the difference between means crosses zero, it indicates no significant difference. If it does not cross zero, it indicates a significant difference between the means.
Outlines
📚 Introduction to Independent Sample T-Test Analysis
This paragraph introduces the topic of the video, which is the analysis of the Independent Sample T-Test, a statistical method used to compare the means of two independent groups. The video aims to demonstrate how to perform and interpret this test using SPSS. The narrator, Tian, explains the purpose of the test, which is to determine if there is a statistically significant difference between the means of two groups, such as males and females. The paragraph outlines the conditions under which the Independent Sample T-Test is appropriate, including the requirement for the independent variable to be dichotomous and the dependent variable to be continuous. It also mentions the assumptions that must be met for the test to be valid, such as independence of observations and normal distribution of the data.
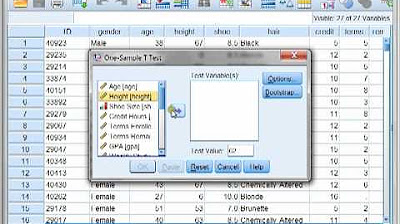
🔍 Setting Up Data for Independent Sample T-Test in SPSS
The second paragraph delves into the structure of the data required for an Independent Sample T-Test in SPSS. It explains that the independent variable should be in one column and the dependent variable in another. The paragraph also discusses the flexibility of SPSS to handle datasets with multiple dependent variables and how to specify the test and grouping variables within the software. The data used in the demonstration includes the heights and academic scores of male and female students from rural and urban schools. The variables are examined in the Variable View to ensure they are appropriate for the test, confirming that the gender and school location variables are nominal and dichotomous.
📝 Hypothesis Formulation for T-Test Analysis
This paragraph emphasizes the importance of stating hypotheses before conducting the T-Test analysis. It outlines the null hypothesis, which assumes no significant difference between the two population means, and the alternative hypothesis, which posits that there is a significant difference. The paragraph also guides the viewer through the process of selecting variables for the test in SPSS, including how to define groups for categorical variables and how to interpret the results based on the t-value, P-value, and confidence intervals.
📉 Interpreting T-Test Results for Height Data
The fourth paragraph focuses on interpreting the results of the Independent Sample T-Test for the height data of male and female students. It explains how to read the group statistics and inferential statistics tables, including the Levene's test for homogeneity of variances and the T-test for equality of means. The paragraph demonstrates three methods to determine if there is a significant difference in height between males and females: comparing the T-value to the critical value, examining the P-value, and analyzing the 95% confidence interval. The results indicate that there is a significant difference in height between the two genders.
🚫 Limitations of Using Multiple Independent Variables in SPSS
The fifth paragraph discusses the limitations of using more than one independent variable in the Independent Sample T-Test within SPSS. It shows that while it's possible to analyze multiple dependent variables simultaneously, only one independent variable can be used at a time in the grouping variable box. The paragraph also describes the process of defining groups for the independent variable and the importance of interpreting the results for each dependent variable separately.
🧪 Analyzing Academic Scores and Interpreting T-Test Results
The final paragraph presents an analysis of academic scores in mathematics, physics, and chemistry for male and female students. It explains how to interpret the T-Test results for each subject, considering the homogeneity of variances as indicated by the Levene's test. The paragraph uses T-values, P-values, and confidence intervals to determine if there are significant differences in scores between males and females for each subject. The results show no significant difference in mathematics and physics scores, but a significant difference in chemistry scores.
📈 Conclusion and Encouragement to Subscribe
In the concluding paragraph, the narrator summarizes the process of performing and interpreting the Independent Sample T-Test in SPSS. They encourage viewers to like, share, and subscribe to the channel for more informative content. The paragraph serves as a reminder of the educational value of the video and an invitation for viewers to engage with the channel for future updates.
Mindmap
Keywords
💡Independent Sample T Test
💡Hypothesis
💡Significance Level
💡Degrees of Freedom
💡Confidence Interval
💡Levene's Test
💡Nominal Variable
💡Continuous Variable
💡Parametric Test
💡Homogeneity of Variance
💡SPSS
Highlights
Introduction to the video series on T Test analysis, focusing on the Independent Sample T Test in SPSS.
Explanation of the Independent Sample T Test as a statistical method to compare means of two independent groups.
The necessity of measuring separate groups like males and females to compute mean values for comparison.
The importance of rejecting the null hypothesis if a significant difference is found between group means.
Guidelines on when to use the Independent Sample T Test, specifically with dichotomous independent variables.
Clarification on the limitations of the Independent Sample T Test when more than two groups are involved, suggesting the use of ANOVA instead.
Assumptions required for the Independent Sample T Test, including continuous dependent variable and normal distribution.
Description of the nonparametric alternative, the Mann-Whitney test, for cases where assumptions are not met.
Demonstration of data loading and assumption testing in SPSS for the Independent Sample T Test.
Instructions on structuring data for the T Test with the independent variable in one column and the dependent variable in another.
How to state hypotheses for the T Test, with the null hypothesis assuming equal population means and the alternative hypothesis assuming they are not.
Step-by-step guide on performing the Independent Sample T Test in SPSS, including selecting test and grouping variables.
Interpretation of the Levene's test for homogeneity of variances and its implications for T Test results.
Three methods to interpret T Test results: T value comparison, P value assessment, and 95% confidence interval evaluation.
Demonstration of analyzing multiple dependent variables simultaneously in SPSS, with a focus on gender differences in academic scores.
Analysis of variances and means in mathematics, physics, and chemistry scores between male and female students.
Conclusion on the significance of differences in chemistry scores between genders, with no significant differences in mathematics and physics.
Encouragement for viewers to replicate the procedure for their own data analysis and interpretation.
Call to action for viewers to like, share, subscribe, and receive notifications for new content on the channel.
Transcripts
Browse More Related Video
Three Different t tests using SPSS with Dr Ami Gates

SPSS (9): Mean Comparison Tests | T-tests, ANOVA & Post-Hoc tests
Independent Sample t-Test in SPSS Tutorial (SPSS Tutorial Video #13) - Comparing Two Groups
Two-Sample t Test in R (Independent Groups) with Example | R Tutorial 4.2 | MarinStatsLectures

What is Effect Size ? Explained in a simple and Easy way

Significance vs. Effect Size for One Way ANOVA using SPSS
5.0 / 5 (0 votes)
Thanks for rating: