Average or Central Tendency: Arithmetic Mean, Median, and Mode
TLDRThis video script delves into the concept of central tendency, explaining the average of a set of numbers through various measures. It introduces the arithmetic mean, which is the sum of numbers divided by their count, and illustrates its calculation with an example set. The script also discusses the median, the middle value in an ordered list, and contrasts it with the mean, highlighting its robustness against outliers. Lastly, it touches on the mode, the most frequent number, noting its utility in datasets with repetitive values and its limitations in more uniform distributions.
Takeaways
- 📊 The script introduces the concept of 'average' as a measure of central tendency for a set of numbers.
- 🔢 The arithmetic mean is calculated by summing all numbers in a set and dividing by the count of numbers.
- 🧮 An example calculation is provided to find the arithmetic mean of the numbers 2, 3, 3, 3, 4, 4, and 10, resulting in 4 and 1/7.
- 📈 The arithmetic mean can be skewed by outliers, such as a large number like 10 in the example set, which can make the average seem higher than the central tendency.
- 🔄 The median is another type of average, which is the middle number in a set when ordered from least to greatest.
- 🔄 For an even number of data points, the median is the average of the two middle numbers.
- 🔄 The script explains that the median is less sensitive to outliers and can be a better representation of central tendency in skewed data sets.
- 📊 The mode is the most frequently occurring number in a set and is another measure of central tendency.
- 📊 The script points out that the mode may not be useful in sets where all numbers occur with the same frequency.
- 📈 The importance of choosing the right measure of central tendency is emphasized, depending on the distribution of the data set.
- 📚 The script concludes by highlighting the practicality of using central tendency to represent large data sets succinctly.
Q & A
What is the central tendency in the context of the given script?
-The central tendency refers to a measure that represents the center or middle of a set of numbers, which in the script is discussed as the average of the numbers.
What is the arithmetic mean and how is it calculated?
-The arithmetic mean is a common type of average that is calculated by summing all the numbers in a set and then dividing by the count of numbers. In the script, it is calculated as (2 + 3 + 3 + 3 + 4 + 4 + 10) / 7.
What is the result of the arithmetic mean for the set of numbers provided in the script?
-The arithmetic mean of the set of numbers is 29 divided by 7, which equals 4 and 1/7 or approximately 4.14 when expressed as a decimal.
How does the presence of an outlier affect the arithmetic mean?
-An outlier, a number significantly larger or smaller than the rest, can skew the arithmetic mean and make it less representative of the central tendency of the data set.
What is the median and how is it found?
-The median is another measure of central tendency that is the middle number in a sorted list of numbers. If there is an even number of observations, the median is the average of the two middle numbers.
What is the median of the set of numbers in the script?
-The median of the provided set is 3, as it is the middle number when the set is ordered from least to greatest.
What happens to the median if there are two middle numbers in a data set?
-If there are two middle numbers, the median is calculated as the average of these two numbers, which is done to find the central value in the data set.
Why might the median be a better measure of central tendency than the arithmetic mean in certain situations?
-The median is less sensitive to extreme values or outliers and can provide a more accurate representation of the central tendency when the data set contains numbers that are significantly larger or smaller than the rest.
What is the mode and how does it differ from the other measures of central tendency?
-The mode is the most frequently occurring number in a data set and is different from the mean and median as it does not involve any calculations of sums or averages but simply identifies the most common value.
What is the mode of the set of numbers in the script?
-The mode of the set is 3, as it is the number that appears most frequently in the set.
What is the potential issue with using the mode as a measure of central tendency?
-The mode can be ambiguous when all numbers in a set occur with the same frequency, as there is no single most frequent number to identify as the mode.
Outlines
📊 Understanding Central Tendency: The Arithmetic Mean
The first paragraph introduces the concept of central tendency in a set of numbers and explains the process of finding the arithmetic mean. It illustrates this with a set of numbers including three 3's, two 4's, and a 10, adding up to 29 and then dividing by the total count of 7 to get an average of 4 and 1/7. The paragraph emphasizes the impact of outliers, like the number 10, on skewing the average and how the arithmetic mean is the most commonly referred to 'average' in everyday language.
🔢 Exploring the Median and Its Robustness to Outliers
The second paragraph delves into the median as a measure of central tendency, which is the middle number in a sorted list of numbers. It contrasts the median with the arithmetic mean by showing how the median remains at 3 for the original set, while the mean is affected by the outlier (10). The paragraph further explains that the median is less sensitive to extreme values and provides an example with an additional number, 1 million, to demonstrate how the median remains representative of the central tendency despite the presence of outliers.
Mindmap
Keywords
💡Central Tendency
💡Arithmetic Mean
💡Median
💡Mode
💡Outlier
💡Skewed Data
💡Data Set
💡Contextual Sensitivity
💡Representativeness
💡Frequency
💡Statistical Measures
Highlights
Introduction to the concept of finding the central tendency of a set of numbers through the average.
Explanation of the arithmetic mean, which is the sum of numbers divided by the count.
Calculation of the arithmetic mean for a specific set of numbers (2, 3, 3, 3, 4, 4, 10).
The result of the arithmetic mean calculation is 4 and 1/7, indicating a central tendency skewed by the outlier 10.
Introduction to the median as another measure of central tendency, defined as the middle number in a sorted list.
Demonstration of finding the median for a set of seven numbers where the middle number is clearly identified as 3.
Clarification on how to calculate the median when there is an even number of data points, using the average of the two middle numbers.
Comparison of the arithmetic mean and median for a set of numbers, showing they can differ significantly due to outliers.
The impact of outliers on the arithmetic mean, causing it to be less representative of the dataset than the median.
Introduction to the mode as the most frequent number in a dataset, serving as another measure of central tendency.
Identification of the mode in the given dataset as the number 3, due to its highest frequency.
Discussion on the limitations of the mode when all numbers in a dataset occur with equal frequency.
The importance of choosing the right measure of central tendency based on the dataset characteristics, such as the presence of outliers.
Illustration of how adding an extreme value like 1 million affects the arithmetic mean but not the median.
The median's robustness against outliers, maintaining its position as a good central tendency measure even with extreme values.
The practical applications of understanding central tendency in representing large datasets succinctly.
The conclusion emphasizing the importance of considering different types of averages when analyzing data.
Transcripts
Browse More Related Video
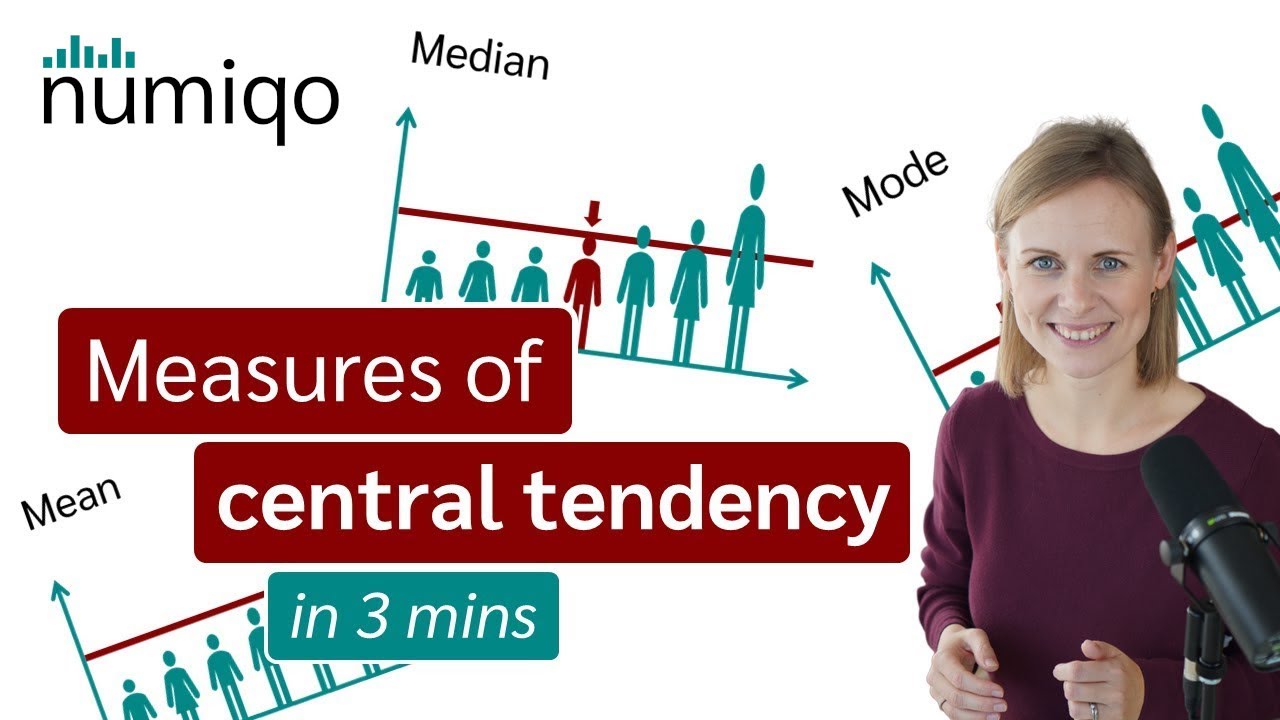
Mean, Median and Mode - Measures of Central Tendency
Finding mean, median, and mode | Descriptive statistics | Probability and Statistics | Khan Academy
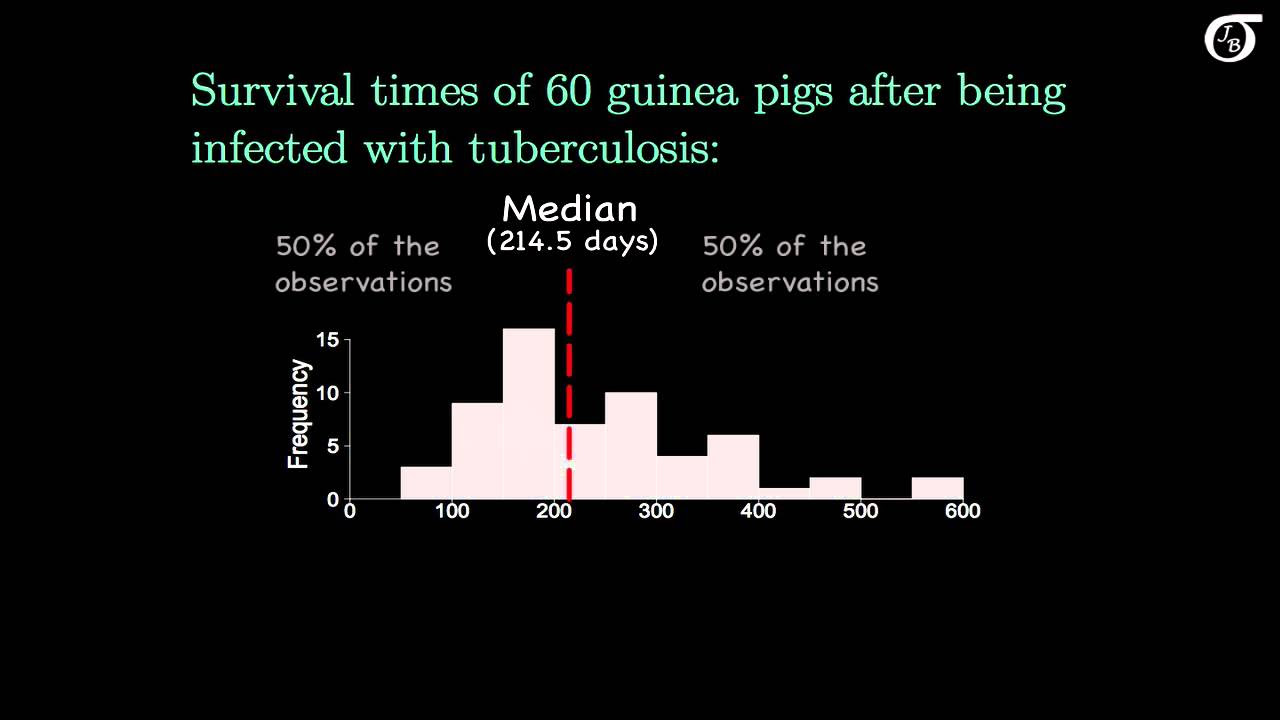
Measures of Central Tendency
Statistics intro: Mean, median, and mode | Data and statistics | 6th grade | Khan Academy

Mode, Median, Mean, Range, and Standard Deviation (1.3)
An Average Video | Mean, Median, Mode, and Range
5.0 / 5 (0 votes)
Thanks for rating: