Statistics intro: Mean, median, and mode | Data and statistics | 6th grade | Khan Academy
TLDRThe video script introduces the audience to the world of statistics, focusing on the concept of descriptive statistics as a method to understand and summarize data. It explains the importance of finding a representative number that captures the essence of a data set without listing all individual data points. The script delves into three primary measures of central tendency: the arithmetic mean, which is the sum of all numbers divided by the count; the median, which is the middle number in an ordered set; and the mode, which is the most frequently occurring number. The video emphasizes that each measure serves different purposes and is suitable for different types of data, highlighting the human-constructed nature of these statistical tools and their utility in making inferences and drawing conclusions from data.
Takeaways
- 📊 **Statistics and Data**: Statistics is a method to understand and analyze data, focusing on descriptive and inferential statistics.
- 📈 **Descriptive Statistics**: It involves describing data with a smaller set of numbers to summarize the data without presenting all of it.
- 🔢 **Central Tendency**: The goal is to find a number that represents the center or typical value of a data set.
- 🧮 **Arithmetic Mean**: Also known as the average, it is the sum of all numbers divided by the count of numbers, representing a central tendency.
- 📌 **Median**: The middle number in an ordered data set; if even, it's the average of the two middle numbers, representing another form of central tendency.
- 🏆 **Mode**: The most frequently occurring number in a data set, which can also represent central tendency.
- 🤔 **Choosing the Right Measure**: Different measures of central tendency are suitable for different situations, such as mean for general trends, median for skewed data, and mode for frequency analysis.
- 📐 **Ordering Data**: To find the median, data must be ordered from smallest to largest, which helps in identifying the middle value(s).
- 📊 **Human-Constructed Definitions**: Measures like the arithmetic mean are human-defined and found useful for statistical analysis, not naturally occurring like mathematical constants.
- 🌱 **Plant Height Example**: The script uses the example of plant heights to illustrate how statistics can be applied to real-world data.
- 🔁 **Repeating Decimals**: The arithmetic mean can sometimes result in repeating decimals, which are a way to represent fractions in decimal form.
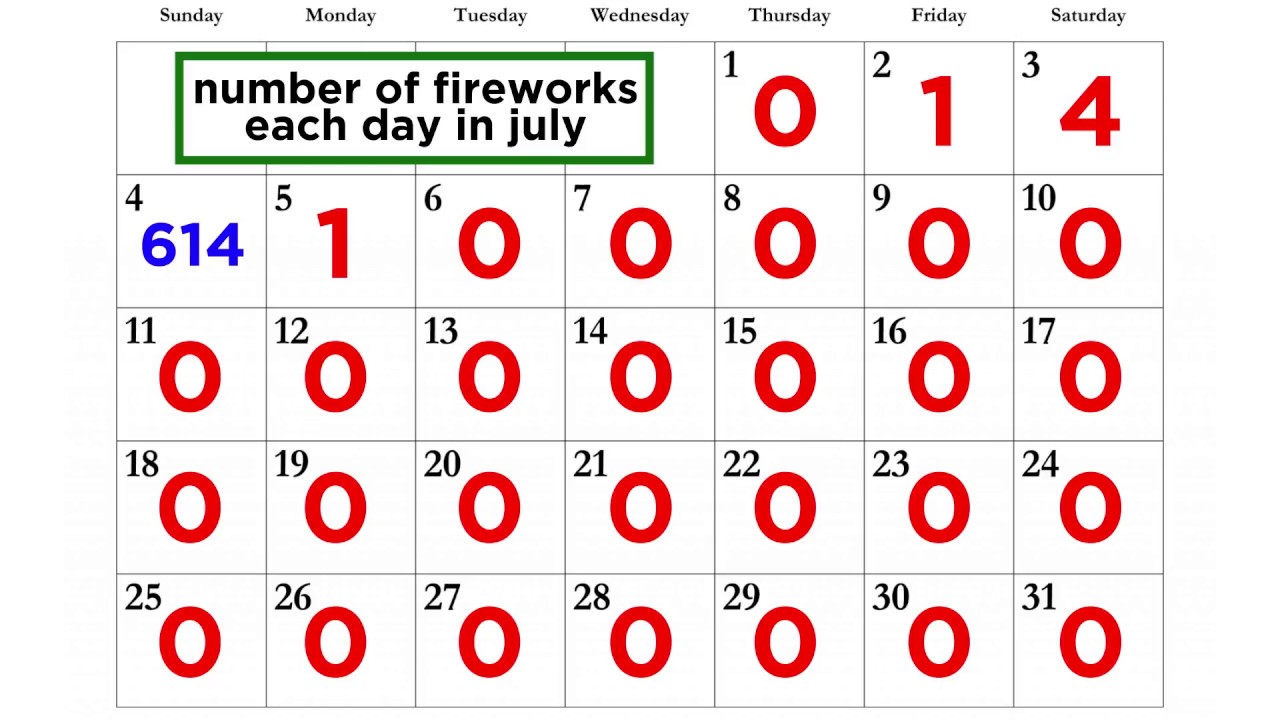
- 🚫 **Skewed Data**: The median is less affected by outliers or extreme values, making it a robust measure when data is skewed.
Q & A
What is the main focus of the video script?
-The main focus of the video script is to introduce the concept of statistics, particularly descriptive statistics, and explain how to describe a set of data using various measures of central tendency such as the mean, median, and mode.
What is the purpose of descriptive statistics?
-Descriptive statistics is used to summarize and organize data in a way that provides a clear and concise description without presenting all the data points. It helps to describe the data with a smaller set of numbers that can represent the entire dataset.
What is the arithmetic mean and how is it calculated?
-The arithmetic mean, often referred to simply as the mean, is a measure of central tendency that is calculated by summing all the numbers in a dataset and then dividing by the count of numbers. It represents a typical or average value in the dataset.
How does the median differ from the arithmetic mean?
-The median is the middle number in a dataset when the numbers are arranged in ascending order. If there is an even number of data points, the median is the average of the two middle numbers. Unlike the mean, the median is not affected by extremely high or low values and thus can be a better measure of central tendency in such cases.
What is the mode and when is it useful?
-The mode is the most frequently occurring number in a dataset. It is particularly useful when there is a need to identify the most common value or when the dataset contains categorical data where the mean and median might not be as informative.
Why might the mode not be applicable in some datasets?
-The mode is not applicable in datasets where all numbers occur with the same frequency, meaning there is no single most common number. In such cases, the dataset is said to have no mode.
How does the video script illustrate the calculation of the arithmetic mean?
-The script provides a step-by-step calculation of the arithmetic mean using the heights of six plants with measurements of 4 inches, 3 inches, 1 inch, 6 inches, 1 inch, and 7 inches. It sums these values and divides by the number of plants to find the mean.
What is the median of the dataset provided in the script?
-The median of the dataset (1, 1, 3, 4, 6, 7) is 3.5, which is the average of the two middle numbers (3 and 4) since there is an even number of data points.
How does the video script demonstrate the concept of the mode?
-The script identifies the mode by showing that in the dataset (1, 1, 3, 4, 6, 7), the number 1 appears most frequently, making it the mode of the dataset.
What is the significance of understanding different measures of central tendency?
-Understanding different measures of central tendency is significant because each measure can provide unique insights into the data. The appropriate measure to use depends on the nature of the dataset and the specific questions one is trying to answer about the data.
Why are human-constructed definitions like the arithmetic mean considered useful in statistics?
-Human-constructed definitions like the arithmetic mean are useful because they provide a standardized way to summarize and interpret data. They allow for meaningful comparisons across different datasets and are foundational in making inferences and drawing conclusions from statistical analysis.
Outlines
📊 Introduction to Descriptive Statistics
The first paragraph introduces the concept of statistics as a method to understand and interpret data. It emphasizes the importance of descriptive statistics, which involves summarizing data with a smaller set of numbers to describe the entire dataset. The paragraph also mentions the future discussion of inferential statistics, which allows for making inferences and conclusions based on the data. An example is given using the heights of six plants, illustrating how one might describe these heights with a single representative number, such as an average. The concept of 'average' in statistics is introduced as a measure of central tendency, with the arithmetic mean being a common example. The arithmetic mean is calculated as the sum of all numbers divided by the count of numbers, demonstrated with the given plant heights, resulting in a mean of 3 and 2/3 or 3.6 repeating.
📈 Exploring Different Measures of Central Tendency
The second paragraph delves into alternative measures of central tendency besides the arithmetic mean. It introduces the median, which is the middle number in a sorted list of numbers. The median is calculated for two given data sets: one with an even number of observations, where the median is the average of the two middle numbers (3.5 in this case), and one with an odd number of observations, where the median is the single middle number (50 in this case). The mode, another measure of central tendency, is also explained as the most frequently occurring number in a dataset. Using the original dataset of plant heights, the mode is determined to be 1, as it appears twice while other numbers appear only once. The paragraph concludes by noting that these different measures of central tendency have their own uses and are suited to different types of data analysis.
Mindmap
Keywords
💡Statistics
💡Descriptive Statistics
💡Inferential Statistics
💡Data
💡Arithmetic Mean
💡Median
💡Mode
💡Central Tendency
💡Skew
💡Outliers
💡Human-Constructed Definition
Highlights
Statistics is fundamentally about understanding and interpreting data.
Descriptive statistics is focused on summarizing data with a smaller set of numbers.
Inferential statistics allows making inferences, conclusions, and judgments about data.
Descriptive statistics begins with the concept of an 'average' or 'central tendency'.
Arithmetic mean is a common way to find a typical or middle number in a data set.
The arithmetic mean is calculated as the sum of all numbers divided by the count of numbers.
The median is the middle number in an ordered data set and is useful for skewed data.
When there's an even number of data points, the median is the average of the two middle numbers.
The mode is the most frequently occurring number in a data set.
If all numbers occur with equal frequency, there is no mode.
Different measures of central tendency are useful in different statistical scenarios.
The arithmetic mean is a human-constructed definition found useful in statistics.
The median is easier to compute with an odd number of data points.
The mode can be particularly useful when one number appears significantly more often than others.
Statistics involves human judgment in deciding which measure of central tendency to use.
Understanding the arithmetic mean, median, and mode provides a foundation for deeper statistical analysis.
The choice between mean, median, and mode depends on the nature of the data and the question being asked.
Statistics is a tool for making sense of data through various measures of central tendency.
Transcripts
Browse More Related Video
Finding mean, median, and mode | Descriptive statistics | Probability and Statistics | Khan Academy
Math Antics - Mean, Median and Mode

Finding Mean, Median, and Mode | Math with Mr. J
An Average Video | Mean, Median, Mode, and Range
Analyzing Sets of Data: Range, Mean, Median, and Mode
Mean, Median and Mode - Measures of Central Tendency
5.0 / 5 (0 votes)
Thanks for rating: