Measures of Central Tendency
TLDRThis video script introduces measures of central tendency, focusing on the mean, median, and mode, using a guinea pig survival study as an example. It explains how the mean is the arithmetic average, the median is the middle value, and the mode is the most frequent value. The script highlights the impact of extreme values on the mean and contrasts it with the median's stability. It also discusses the use of both measures in various data scenarios, including skewed distributions, and briefly mentions other measures like the trimmed and weighted means.
Takeaways
- 📊 The video introduces measures of central tendency, focusing on a histogram of guinea pig survival times in days after being infected with tuberculosis.
- 🔢 The sample mean (x-bar) is calculated by summing all observations and dividing by the number of observations, representing the arithmetic mean.
- 🏔 The median is the middle value in an ordered list of observations; for an even number of values, it's the average of the two middle numbers.
- 🆚 The mode is the most frequently occurring value in the sample, but it's less significant when summarizing sample data compared to the mean and median.
- 🌟 Extreme values have a greater impact on the mean than on the median, as the mean is influenced by every data point's actual value.
- 📈 A change in an extreme value, like increasing the largest observation, can significantly affect the mean but not the median.
- ⚖️ The mean can be visualized as the balance point of equally weighted observations on a board, whereas the median would not balance the board.
- 📈 In the guinea pig data, the modal class is the most frequent range of survival times, and the median is found at 214.5 days.
- 📉 The mean is greater than the median in right-skewed distributions and less in left-skewed distributions, equal in perfectly symmetric distributions.
- 📚 It's common to report both the mean and median to allow readers to decide which is more appropriate for a given situation.
- 📘 Other measures of central tendency include the trimmed mean, weighted mean, harmonic mean, and geometric mean, each with specific use cases.
Q & A
What is the purpose of the histogram in the video script?
-The histogram in the video script is used to represent the survival times in days of 60 guinea pigs infected with tuberculosis, illustrating the distribution of the data for analysis.
What are the different measures of central tendency discussed in the script?
-The script discusses the sample mean (x-bar), median, and mode as measures of central tendency used to summarize and describe the data.
How is the sample mean calculated?
-The sample mean is calculated by adding up all the observations and dividing by the number of observations, which is the arithmetic mean.
What is the difference between the arithmetic mean and other kinds of means like the harmonic or geometric mean?
-The arithmetic mean is calculated by summing all observations and dividing by the count, whereas the harmonic mean is based on the reciprocals of the observations, and the geometric mean is the nth root of the product of n observations.
How is the median determined for a dataset?
-The median is the middle value of a dataset when the observations are ordered from smallest to largest. If the dataset has an odd number of observations, the median is the middle value. If even, it's the average of the two middle values.
Why might the mode not be a useful measure of central tendency in some datasets?
-The mode may not be useful in datasets where no number occurs more than once, as every number would then be considered the mode, which does not provide meaningful central information.
How do extreme values affect the mean and median differently?
-Extreme values have a greater impact on the mean because it is influenced by the actual value of every observation. The median, however, is less affected because it is based on the middle value(s) of the dataset.
What is the concept of a fulcrum in the context of the script?
-The fulcrum concept is used as a metaphor to explain how the mean represents the balance point of the data distribution, whereas the median does not necessarily balance the data if used as a fulcrum.
How does the script differentiate between right-skewed and left-skewed distributions in terms of mean and median?
-In right-skewed distributions, the mean is greater than the median due to the influence of larger values in the right tail. Conversely, in left-skewed distributions, the mean is less than the median due to the influence of smaller values in the left tail.
What are some alternative measures of central tendency mentioned in the script?
-The script mentions the trimmed mean, which excludes a certain percentage of the largest and smallest observations before calculating the mean, and the weighted mean, which assigns different weights to observations.
Why might both the mean and median be reported in certain situations?
-Both the mean and median can be reported to provide a more comprehensive understanding of the data, allowing the reader to decide which measure is more appropriate given the presence of extreme values or skewness.
Outlines
📊 Introduction to Measures of Central Tendency
This paragraph introduces the concept of measures of central tendency using a histogram of guinea pig survival times in an experiment studying tuberculosis. The video script explains the sample mean (x-bar) as the arithmetic mean of all observations, the median as the middle value when observations are ordered, and the mode as the most frequently occurring value. It also illustrates the impact of extreme values on the mean versus the median through an example and a physical analogy with weights on a board. The paragraph concludes with a dot plot and number line to visually represent the mean and median.
📈 Comparing Mean and Median in Different Distributions
The second paragraph delves into the comparison between the mean and median in various data distributions. It discusses how larger values in a right-skewed distribution can pull the mean higher than the median, while in a left-skewed distribution, the mean is less than the median due to the influence of smaller values. For a symmetric distribution, the mean and median are equal. The script emphasizes the mean's sensitivity to extreme values compared to the median and suggests reporting both measures to allow readers to determine the most appropriate measure of central tendency. It also briefly mentions other measures of central tendency, such as the trimmed mean, weighted mean, harmonic mean, and geometric mean, and their appropriateness in different scenarios.
Mindmap
Keywords
💡Measures of Central Tendency
💡Histogram
💡Sample Mean (x-bar)
💡Median
💡Mode
💡Skewness
💡Extreme Values
💡Balance Point
💡Modal Class
💡Symmetric Distribution
💡Statistical Inference
💡Trimmed Mean
💡Weighted Mean
Highlights
Introduction to measures of central tendency with a histogram of guinea pig survival times in days infected with tuberculosis.
Explanation of numerical measures of central tendency, such as average and median survival times.
Assumption that the data represents a sample rather than the entire population.
Definition and calculation of the sample mean (x-bar) as the arithmetic mean of observations.
Differentiation between the arithmetic mean and other types of means like harmonic or geometric mean.
Description of the median as the middle value in an ordered set of observations.
Clarification of the mode as the most frequently occurring value in a sample.
Illustration of how extreme values affect the mean more than the median through a numerical example.
Demonstration of the mean's sensitivity to outliers through a dot plot and physical weight analogy.
Identification of the modal class in a histogram as the class with the greatest number of observations.
Explanation of how to determine the median from a histogram and raw data.
Calculation of the sample mean and comparison with the median in the context of guinea pig survival time data.
Discussion on the impact of distribution skewness on the relationship between mean and median.
Comparison of mean and median in symmetric and skewed distributions.
Advantages and disadvantages of using the mean as a measure of central tendency.
Recommendation to report both mean and median to allow readers to choose the appropriate measure.
Introduction to alternative measures of central tendency such as trimmed mean and weighted mean.
Differentiation between various types of means including arithmetic, harmonic, and geometric mean.
Conclusion on the appropriateness of mean and median as measures of central tendency in different situations.
Transcripts
Browse More Related Video
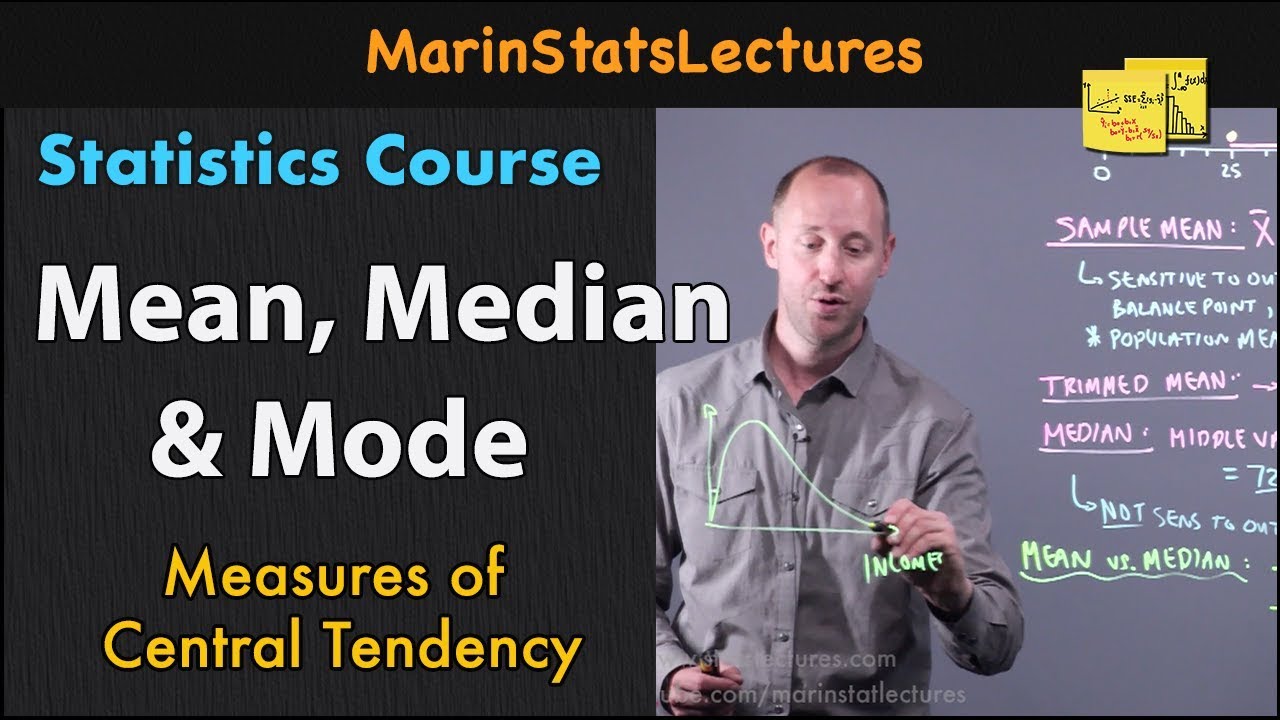
Mean, Median and Mode in Statistics | Statistics Tutorial | MarinStatsLectures
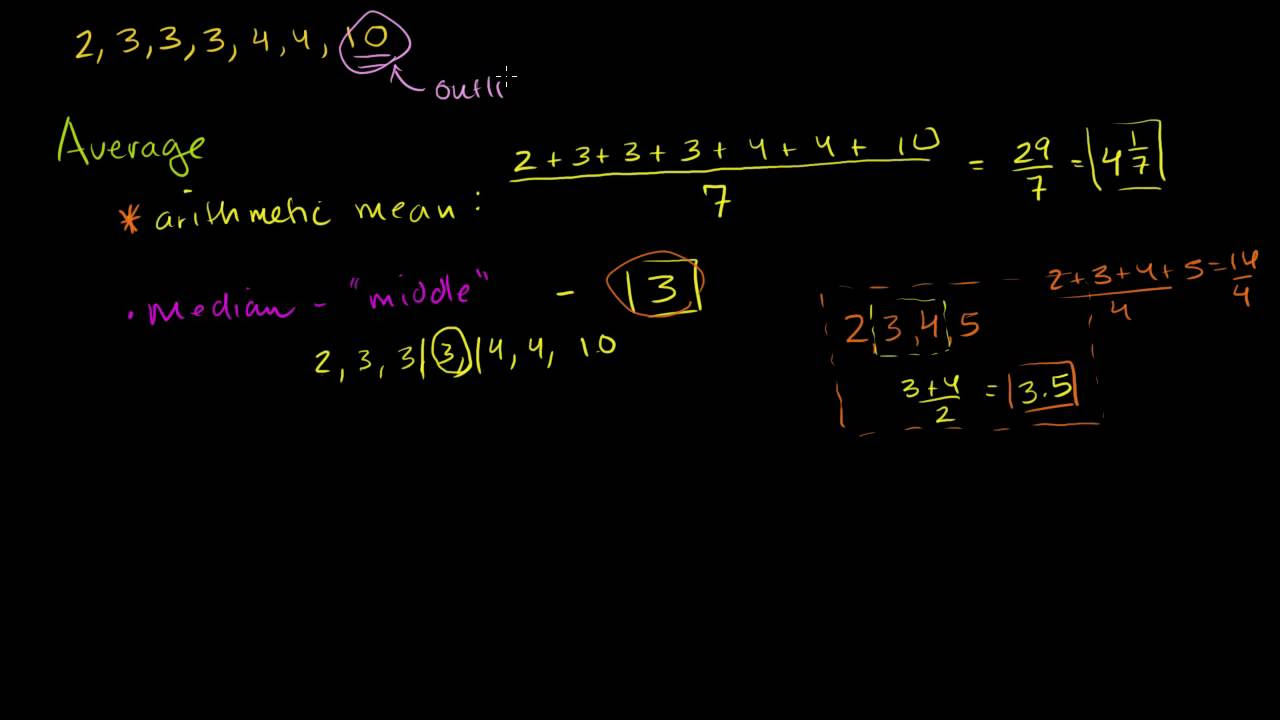
Average or Central Tendency: Arithmetic Mean, Median, and Mode

Mode, Median, Mean, Range, and Standard Deviation (1.3)
Mean, Median and Mode - Measures of Central Tendency
Finding mean, median, and mode | Descriptive statistics | Probability and Statistics | Khan Academy
Mean, Median, and Mode: Measures of Central Tendency: Crash Course Statistics #3
5.0 / 5 (0 votes)
Thanks for rating: