Mode, Median, Mean, Range, and Standard Deviation (1.3)
TLDRThis educational video script delves into key statistical concepts, including mode, median, mean, range, and standard deviation, which are pivotal for understanding data distribution. It explains how mode is the most frequently occurring value, median as the middle value in an ordered set, and mean as the average. The script also covers how to calculate these measures, emphasizing the median's position for odd and even datasets. Furthermore, it distinguishes between measures of central tendency and spread, illustrating the calculation of range and standard deviation with a step-by-step approach. Variance is also briefly mentioned, highlighting its relationship with standard deviation. The script serves as an informative guide for anyone looking to grasp the fundamentals of statistical analysis.
Takeaways
- 📊 The video discusses five key statistical measures: mode, median, mean, range, and standard deviation.
- 🔢 Mode is the value that appears most frequently in a dataset, and in the example, the mode is 154.
- 🎯 Median is the middle value in an ordered dataset, and it is 154 in the provided example with an odd number of data points.
- 📈 To find the median in a large dataset, the formula (n + 1) / 2 can be used to determine its position.
- 📚 If the dataset has an even number of values, the median is the average of the two middle numbers, as shown with the calculation of 154.5.
- 🧮 Mean, or arithmetic average, is calculated by summing all data values and dividing by the total number of values, resulting in 165.6 for the example.
- ⚖️ Median and mean are both measures of central tendency but represent the center of the dataset in different ways.
- 📏 Range is a measure of spread, calculated by subtracting the smallest value from the largest, which is 57 in the example.
- 🔍 Standard deviation is a measure of how spread out the values are around the mean, calculated using a specific formula and resulting in 4.336 for the example.
- 📉 A small standard deviation indicates less variability and values closer to the mean, whereas a large standard deviation indicates more spread.
- 📊 Variance is closely related to standard deviation but does not involve taking the square root of the calculations, denoted as s² for sample variance.
Q & A
What are the five numerical measures discussed in the video?
-The five numerical measures discussed in the video are mode, median, mean, range, and standard deviation.
What is the mode of a dataset?
-The mode of a dataset is the data value that appears most frequently. In the example given, the mode is 154 since it appears three times.
How is the median of a dataset determined?
-The median is the middle value of an ordered dataset. If the dataset has an odd number of values, the median is the value in the exact middle. For an even number of values, the median is the average of the two middle values.
What formula is used to find the position of the median in a dataset?
-The formula used to find the position of the median is n + 1/2, where n is the total number of data values in the sample.
What is the mean of a dataset?
-The mean, also known as the arithmetic average, is calculated by summing all data values and dividing by the total number of data values.
How does the median differ from the mean as a measure of central tendency?
-The median represents the physical middle point of a dataset, while the mean represents the balance point or average value. The median is less affected by outliers, whereas the mean can be skewed by extreme values.
What is the range of a dataset?
-The range is the difference between the maximum and minimum values in a dataset, indicating the spread or dispersion of the data.
How is the standard deviation calculated?
-The standard deviation is calculated by taking the square root of the variance, which is the average of the squared differences from the mean.
What does a small standard deviation indicate about a dataset?
-A small standard deviation indicates that the data points are closely clustered around the mean, suggesting less variability and a more concentrated distribution.
What is variance and how does it relate to standard deviation?
-Variance is a measure of the spread of a dataset and is closely related to standard deviation. The only difference is that variance does not involve taking the square root of the calculations, unlike standard deviation.
How can you determine if a dataset is more spread out based on its standard deviation?
-If the standard deviation is high, it indicates a high amount of variability, meaning that there are more values that are farther from the mean, which makes the distribution more spread out.
Outlines
📊 Understanding Measures of Central Tendency and Spread
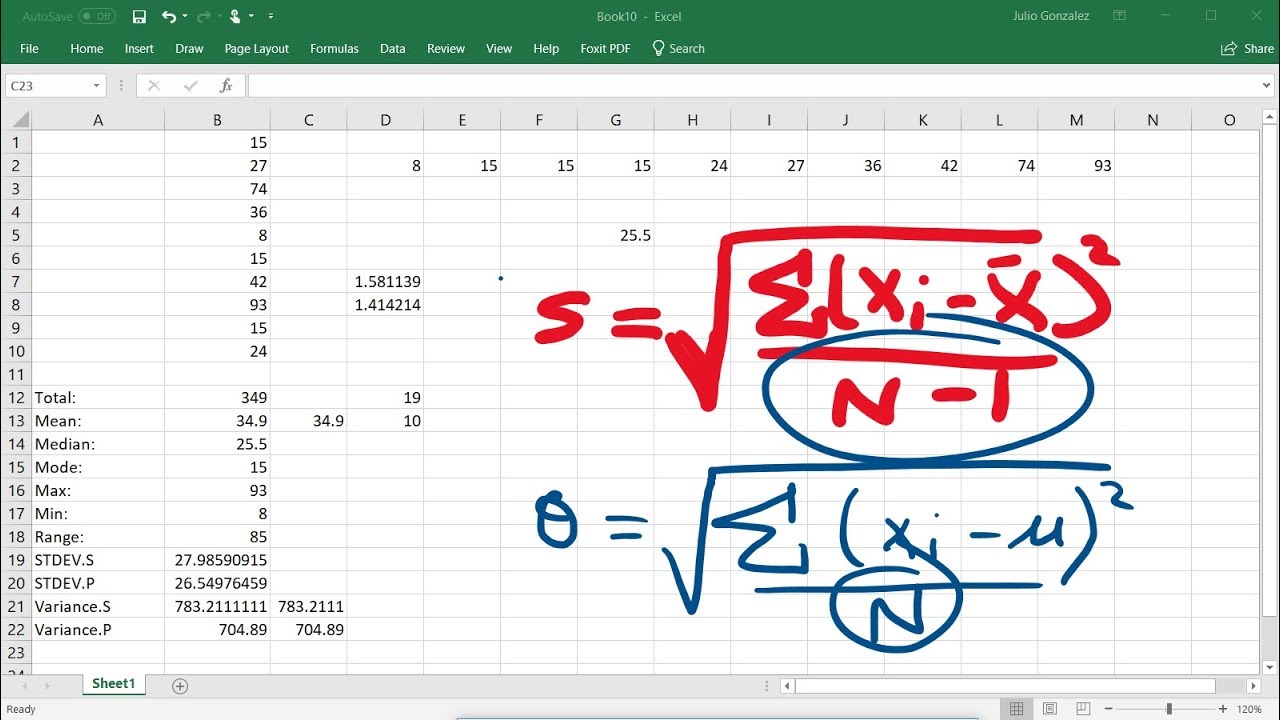
This paragraph introduces the statistical concepts of mode, median, mean, range, and standard deviation as numerical ways to describe the distribution of a dataset. The mode is the most frequently occurring value, illustrated with an example where the mode is 154 cm in a dataset of nine people's heights. The median is the middle value when data is ordered, which in this case is also 154 cm. The mean, or arithmetic average, is calculated by summing all values and dividing by the total count, resulting in a mean height of 165.6 cm for the sample. The paragraph also explains how to calculate the median for both odd and even numbers of data points and compares the median to the mean as measures of central tendency. Additionally, it introduces measures of spread, such as range and standard deviation, with the range being the difference between the maximum and minimum values.
📈 Calculating and Interpreting Standard Deviation and Variance
The second paragraph delves into calculating the standard deviation, which measures the amount of variation or dispersion in a dataset. It uses a step-by-step process to demonstrate the calculation, starting with finding the mean, then subtracting each data point from the mean, squaring the results, summing them up, and finally dividing by the total number of data points to find the variance. The standard deviation is the square root of the variance. The example provided calculates a standard deviation of 4.336 for a dataset with a mean of 15.4. The paragraph explains that a small standard deviation indicates less variability and a more concentrated distribution around the mean, while a large standard deviation suggests greater variability and a more spread-out distribution. It also touches on variance, which is closely related to standard deviation but does not involve taking the square root, and both can be referred to as sample variance and sample standard deviation.
Mindmap
Keywords
💡Mode
💡Median
💡Mean
💡Range
💡Standard Deviation
💡Histograms
💡Stem Plots
💡Pie Charts
💡Central Tendency
💡Spread
💡Variance
Highlights
The video discusses mode, median, mean, range, and standard deviation as numerical ways to describe a data distribution.
Mode is the most frequently observed data value in a dataset.
Median is the middle data value in an ordered dataset.
To find the median, data must be ordered from smallest to largest.
For an ordered dataset with an odd number of values, the median is the middle value.
For a large dataset, the median's position can be found using the formula n + 1/2.
If the dataset has an even number of values, the median is the average of the two middle values.
Mean, or arithmetic average, is calculated by summing all data values and dividing by the total number.
Mean represents the balance point of a dataset, like a seesaw.
Range is the difference between the maximum and minimum values in a dataset.
Standard deviation measures the amount of variation or dispersion in a dataset.
A small standard deviation indicates values are close to the mean, while a large one indicates greater variability.
Variance is closely related to standard deviation, differing only in the absence of the square root in its calculation.
Variance and standard deviation can both be referred to as sample variance and sample standard deviation.
The video provides a step-by-step guide on calculating the standard deviation using a formula.
The standard deviation is computed by finding the average of the squared differences from the mean.
The video uses a table to demonstrate the calculation process for standard deviation.
Transcripts
Browse More Related Video
Calculating The Standard Deviation, Mean, Median, Mode, Range, & Variance Using Excel
Mean, Median and Mode - Measures of Central Tendency

Math 119 Chapter 3 part 2

Statistics: Standard deviation | Descriptive statistics | Probability and Statistics | Khan Academy
Elementary Statistics - Chapter 3 Describing Exploring Comparing Data Measure of Central Tendency
Range, variance and standard deviation as measures of dispersion | Khan Academy
5.0 / 5 (0 votes)
Thanks for rating: