12 - Analysis of Variance (ANOVA) Overview in Statistics - Learn ANOVA and How it Works.
TLDRThis video script introduces the concept of Analysis of Variance (ANOVA), a statistical method for comparing the means of three or more populations. The instructor outlines the process of conducting an ANOVA, emphasizing the importance of understanding the formulas and calculations before relying on computer programs like Excel. The script explains the null and alternative hypotheses, the practicality of sampling due to large populations, and the significance of the test in identifying whether at least one population mean differs from the others, without specifying which one.
Takeaways
- 📚 The concept of ANOVA (Analysis of Variance) is introduced as a statistical method for comparing three or more population means at once.
- 🔍 ANOVA is named for its use of variance to compare means, even though the primary focus is on the means themselves.
- 📉 The null hypothesis in ANOVA always assumes that all population means are equal, while the alternative hypothesis suggests at least one mean is different.
- 📝 The process involves calculating sample means from each population and then using these in the ANOVA test to infer about the population means.
- 👨🏫 The instructor emphasizes the importance of understanding the formulas and calculations behind ANOVA before using computer programs like Excel.
- 🧑🎓 The script provides an educational approach to teaching ANOVA, starting with an overview and then diving into detailed calculations in subsequent lessons.
- 🏫 An example scenario involving school test scores is used to illustrate the application of ANOVA in a real-world context.
- 📊 ANOVA is particularly useful for avoiding the cumbersome process of multiple hypothesis tests when comparing more than two population means.
- 🤔 The test results can indicate whether to reject or fail to reject the null hypothesis based on the sample data, but they do not specify which mean is different.
- ⚠️ The validity of ANOVA depends on the quality and representativeness of the sampled data, and outliers or unusual circumstances can affect the outcome.
- 💻 The script concludes with a note on the practicality of using computers for ANOVA calculations due to the complexity and volume of numbers involved.
Q & A
What is the main focus of the video script?
-The main focus of the video script is to introduce and explain the concept of Analysis of Variance (ANOVA), its purpose, and how it is used to compare three or more population means.
Why is ANOVA called 'variance' even though it compares means?
-ANOVA is called 'variance' because it uses the concept of variance to study how the means of different populations vary or differ from one another, even though the actual focus is on comparing means.
What is the null hypothesis in an ANOVA test?
-The null hypothesis in an ANOVA test is that all the population means being compared are equal, i.e., there is no significant difference among the means of the three or more populations.
What is the alternative hypothesis in an ANOVA test?
-The alternative hypothesis in an ANOVA test is that at least one of the population means differs from the others, indicating a significant difference among the means.
Why is it impractical to test all individuals in each population when conducting an ANOVA?
-It is impractical to test all individuals in each population due to limitations such as time, resources, and the sheer size of the population, which may be too large to feasibly test every member.
How does the script suggest understanding the calculations involved in ANOVA?
-The script suggests understanding the calculations by first learning the formulas and equations by hand with a long problem to grasp the concepts before using computer programs like Microsoft Excel for more complex problems.
What is the advantage of using ANOVA over multiple two-sample t-tests when comparing more than two population means?
-The advantage of using ANOVA over multiple two-sample t-tests is that ANOVA allows for the comparison of three or more population means simultaneously, reducing the complexity and potential for errors introduced by multiple pairwise comparisons.
What is the purpose of sampling in the context of ANOVA?
-The purpose of sampling in the context of ANOVA is to obtain a representative subset of data from each population to estimate the population mean and to make inferences about the entire population based on the sample data.
What does the script imply about the importance of the quality of data in ANOVA?
-The script implies that the quality of data is crucial in ANOVA because outliers or poor-quality data can skew the sample mean and affect the outcome of the test, leading to potentially inaccurate conclusions.
What is the script's stance on using a computer for ANOVA calculations?
-The script acknowledges that while it's important to understand the underlying formulas and calculations, using a computer for ANOVA calculations is common and practical due to the large number of calculations involved, especially with more complex datasets.
How does the script illustrate the concept of ANOVA with an example?
-The script illustrates the concept of ANOVA with the example of a school administrator who wants to ensure that students in three different schools are learning the same material, specifically in math, by comparing the average test scores of a sample of students from each school.
Outlines
📚 Introduction to Analysis of Variance (ANOVA)
This paragraph introduces the concept of Analysis of Variance (ANOVA), a statistical method used to compare three or more population means simultaneously. The speaker outlines the lesson plan, which includes an overview of ANOVA, a detailed manual calculation of an ANOVA analysis, and an explanation of how to use computer programs like Microsoft Excel for practical applications. The importance of understanding the formulas behind ANOVA is emphasized, as it provides insight into the computer program's processes. The paragraph sets the stage for a deeper dive into hypothesis testing with multiple population means and the structure of null and alternative hypotheses in this context.
🔍 Hypothesis Testing with Multiple Population Means
The speaker delves into the specifics of hypothesis testing with multiple population means, contrasting it with the traditional method of comparing just two means. The null hypothesis is described as the assumption that all population means are equal, while the alternative hypothesis posits that at least one mean differs from the others. A clear example is provided, involving the comparison of test scores across three different schools, to illustrate the application of ANOVA. The paragraph emphasizes the practicality of ANOVA in educational settings and the importance of understanding the underlying concepts before relying on computer software for analysis.
📉 Understanding Sample Means and Population Means
This paragraph explains the difference between sample means and population means, using the example of testing students from three different schools. The speaker describes how sample means are calculated from a subset of the population and how these are used to infer information about the entire population. The limitations of sample size are discussed, with the acknowledgment that a larger sample size can provide a more accurate representation of the population. The concept of using sample data to perform ANOVA is introduced, highlighting how it accounts for the number of samples taken from each population.
🚫 Limitations and Considerations in ANOVA
The speaker discusses the limitations and considerations of using ANOVA, such as the impracticality of testing an entire population and the potential for errors when conducting multiple hypothesis tests. The paragraph also addresses the importance of the quality of the sampled data and how outliers can affect the results. The speaker emphasizes that while ANOVA can indicate whether one or more population means are different, it does not specify which ones are different, necessitating further analysis for a definitive conclusion.
🔬 The Importance of Data Quality in ANOVA
In this paragraph, the speaker underscores the importance of data quality in ANOVA, explaining how outliers or irregularities in the sample data can skew the results. The potential impact of external factors on test scores, such as a disrupted classroom environment, is highlighted as an example of how data quality can be compromised. The speaker reminds the audience to critically evaluate the data and not to rely solely on ANOVA results without considering the context and quality of the data collected.
Mindmap
Keywords
💡Analysis of Variance (ANOVA)
💡Null Hypothesis
💡Alternate Hypothesis
💡Population Mean
💡Sample Mean
💡Significance Level
💡Hypothesis Testing
💡Outliers
💡Microsoft Excel
💡Tukey's HSD Test
Highlights
Introduction to the concept of Analysis of Variance (ANOVA), a statistical method for comparing three or more population means.
Explanation of why ANOVA is used instead of multiple hypothesis testing, which can be cumbersome and error-prone.
The null hypothesis in ANOVA is always that all population means are equal, while the alternative hypothesis is that at least one mean is different.
ANOVA uses the concept of variance to compare means, despite the method's name implying a focus on variance alone.
The importance of understanding the formulas behind ANOVA calculations before using computer programs like Microsoft Excel.
A practical example of ANOVA is comparing test scores across different schools to ensure equal learning outcomes.
ANOVA is applicable to any scenario with three or more populations, not just educational settings.
The process of sampling from populations to calculate sample means, which are then used in ANOVA.
The significance of sample size in ANOVA and how it can affect the test's outcome.
The limitations of sample means as estimators of population means and the need for sufficient sample sizes.
The potential for ANOVA to detect differences in population means, but not to identify which specific means differ.
The impact of outliers and data quality on the validity of ANOVA results.
The necessity of considering the context and quality of data when interpreting ANOVA results.
A step-by-step guide on how to perform ANOVA calculations by hand to understand the underlying principles.
The transition from manual calculations to using computer programs for efficiency in ANOVA analysis.
A final summary emphasizing the importance of understanding ANOVA's theoretical foundation before relying on computational tools.
Transcripts
Browse More Related Video

ANOVA (Analysis of variance) simply explained
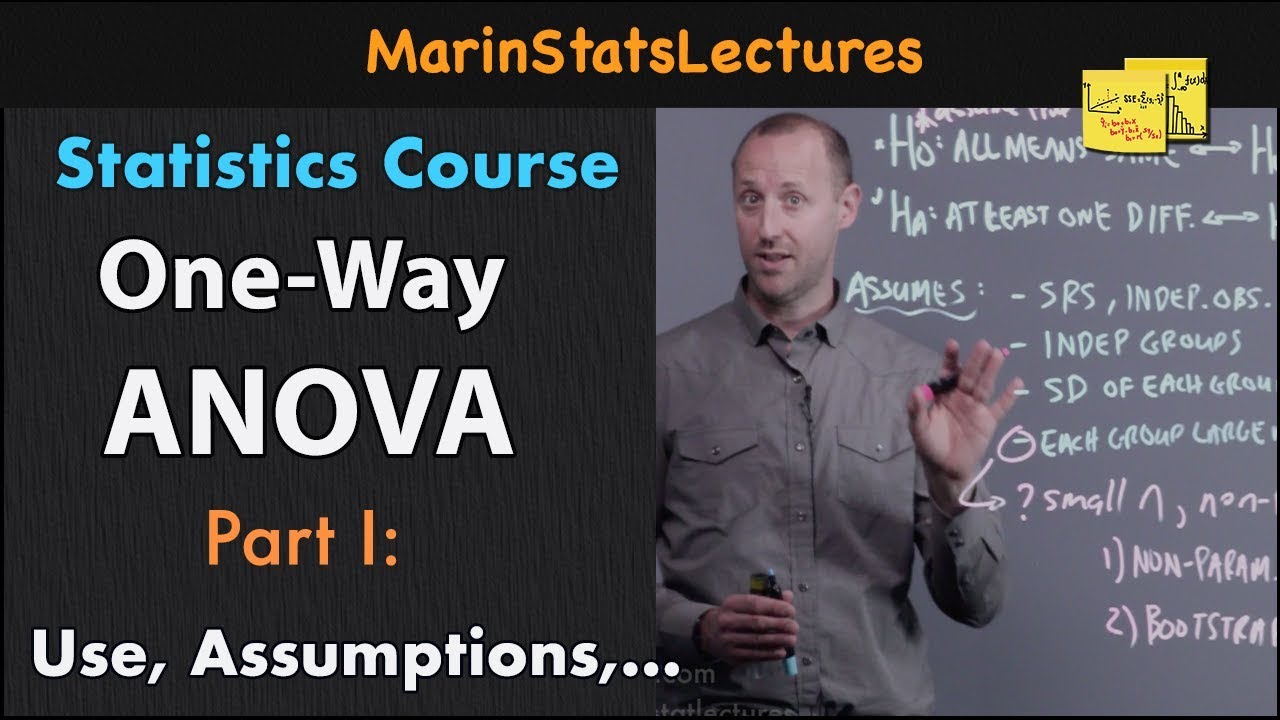
One Way ANOVA (Analysis of Variance): Introduction | Statistics Tutorial #25 | MarinStatsLectures
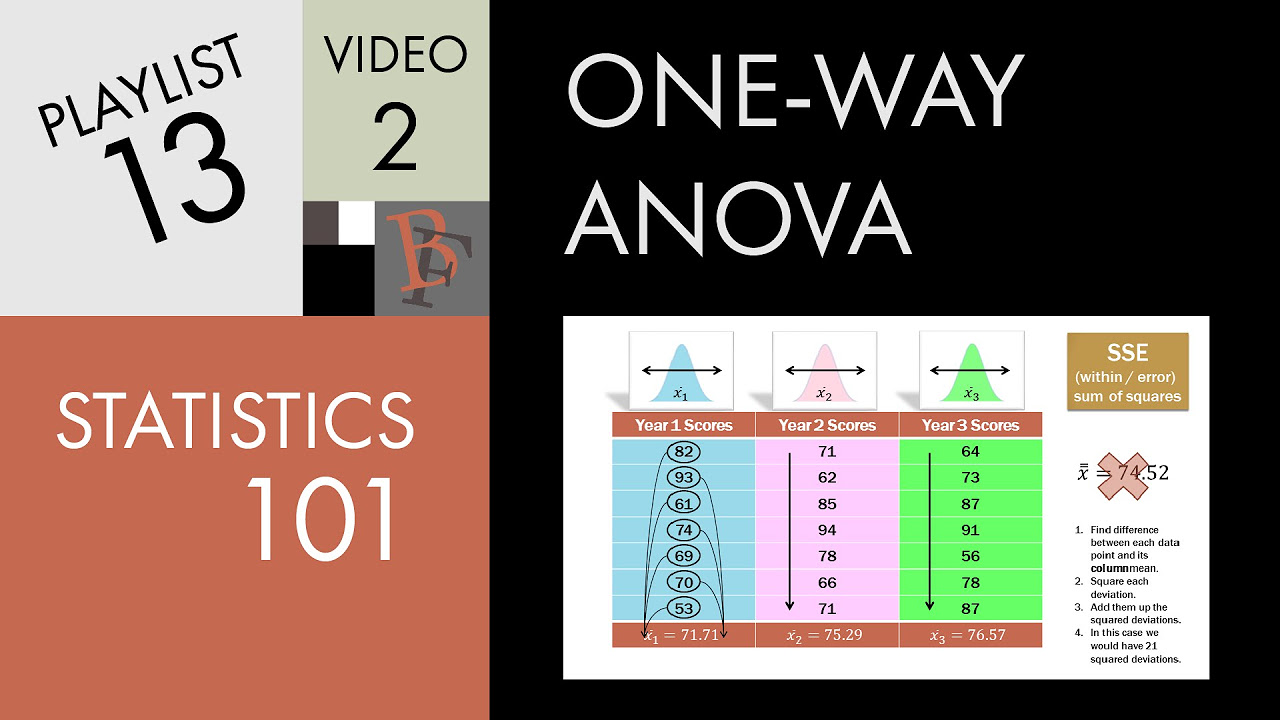
Statistics 101: One-way ANOVA, A Visual Tutorial
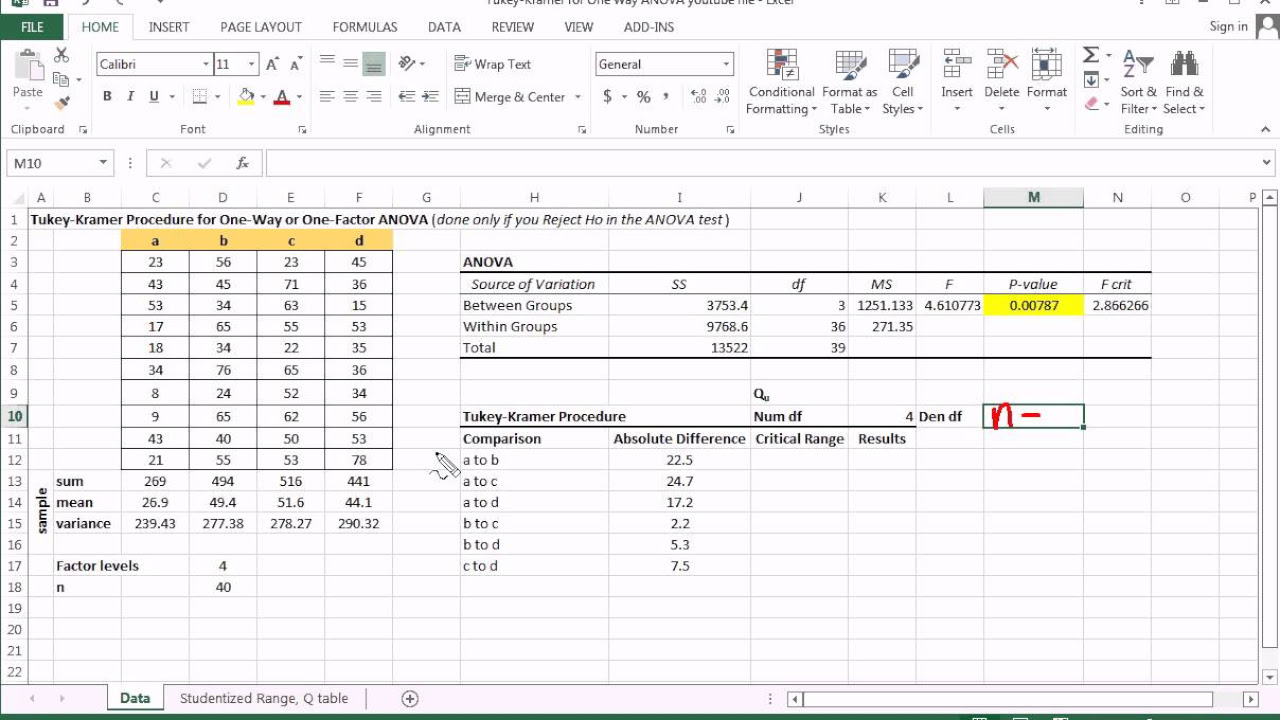
Tukey Kramer Multiple Comparison Procedure and ANOVA with Excel
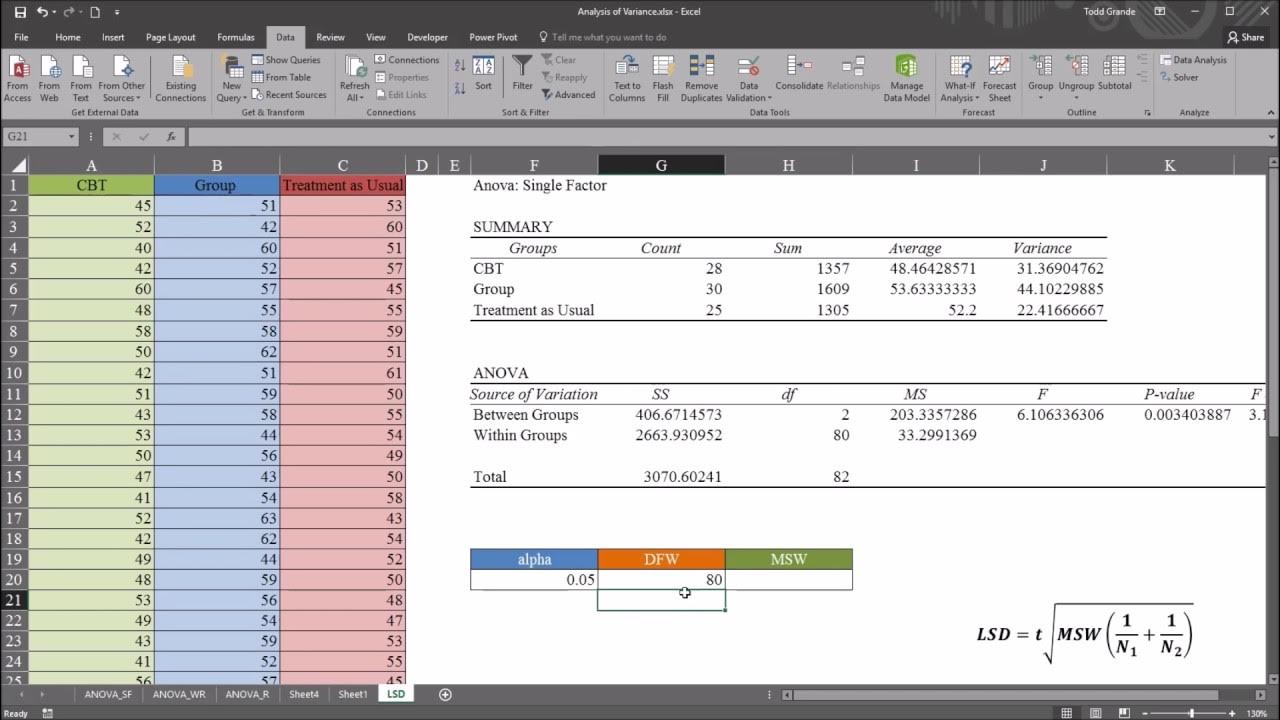
One-Way ANOVA with LSD (Least Significant Difference) Post Hoc Test in Excel
ANOVA Part III: F Statistic and P Value | Statistics Tutorial #27 | MarinStatsLectures
5.0 / 5 (0 votes)
Thanks for rating: