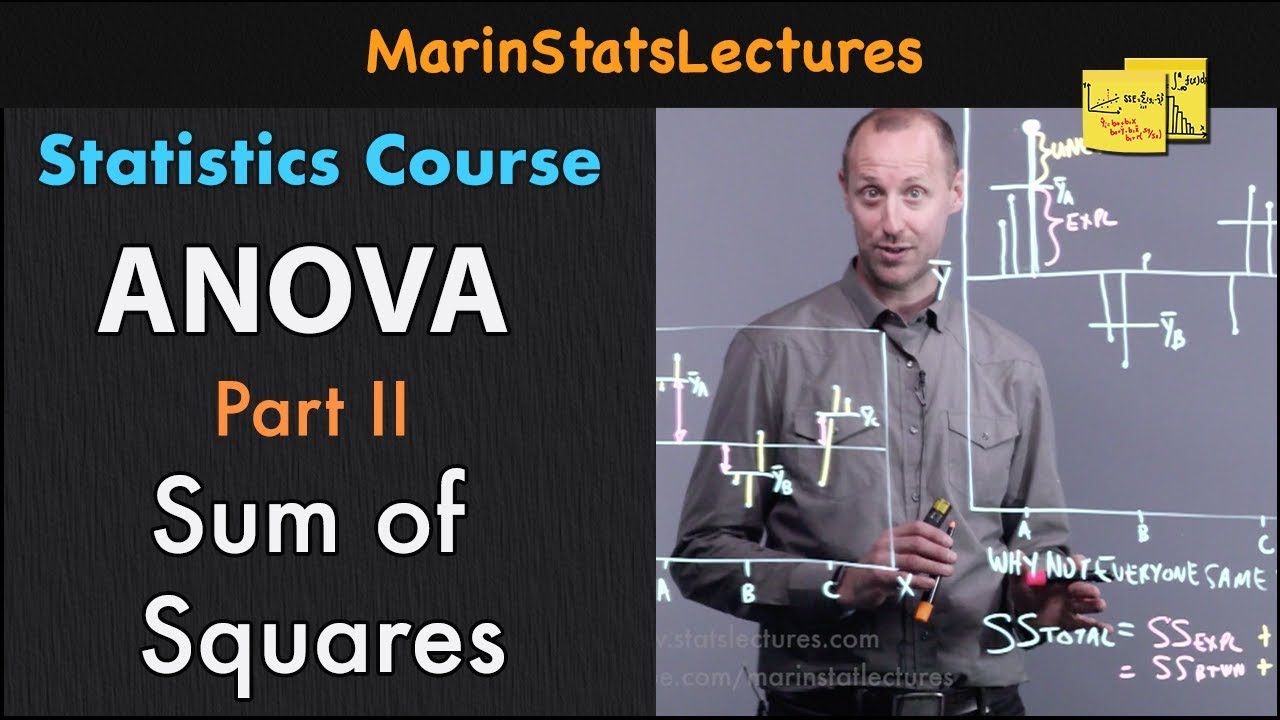
ANOVA Part III: F Statistic and P Value | Statistics Tutorial #27 | MarinStatsLectures
TLDRThis video script delves into the construction of the test statistic for one-way analysis of variance (ANOVA), using a weight loss study across four diets as an example. It explains how to separate total variability into explained (between diets) and unexplained (within groups) components, leading to the calculation of the F statistic. The script emphasizes the importance of comparing mean squares and understanding the implications of an F statistic value, concluding with the interpretation of a p-value that suggests rejecting the null hypothesis in favor of the alternative, indicating that at least one diet is different from the others.
Takeaways
- 📊 The script discusses building the test statistic for one-way analysis of variance (ANOVA), focusing on comparing weight loss across four diets.
- 🧐 The null hypothesis assumes that all diet means are equal, while the alternative hypothesis suggests at least one mean differs.
- 📚 The script emphasizes understanding concepts over memorizing formulas, using notation to explain the components of the test statistic.
- 🔢 The total variability in weight loss is divided into 'explained' (variance between diets) and 'unexplained' (variance within groups) parts.
- 📉 The 'explained' variability is quantified by the sum of squares between groups, divided by its degrees of freedom, which equals 32.4 in the example.
- 📈 The 'unexplained' variability is represented by the mean square within groups, calculated as the sum of squares within divided by its degrees of freedom, yielding 5.3 in the example.
- 🔄 The script explains that the within-group variance is equivalent to the pooled variance in a two-sample t-test under the assumption of equal variances.
- 📐 The F statistic is the ratio of the mean square between groups to the mean square within groups, expected to be greater than 1 if the alternative hypothesis is true.
- 🤔 If the null hypothesis is true, the F statistic is expected to be roughly 1, indicating no significant difference between the diets.
- 📊 The calculated F statistic for the example is 6.1, which is significantly larger than 1, providing evidence against the null hypothesis.
- 📝 The p-value, which is approximately 0.0011, indicates the probability of observing such an F statistic or more extreme if the null hypothesis is true, suggesting strong evidence to reject the null hypothesis.
Q & A
What is the purpose of the one-way analysis of variance (ANOVA) test?
-The purpose of the one-way ANOVA test is to compare the means of three or more independent groups to determine if there is a statistically significant difference between them.
What is the null hypothesis in the context of the one-way ANOVA test?
-The null hypothesis in the one-way ANOVA test is that all group means are equal, meaning there is no significant difference between the groups being compared.
What is the alternative hypothesis for the one-way ANOVA test?
-The alternative hypothesis for the one-way ANOVA test is that at least one group mean is different from the others, indicating a significant difference exists among the groups.
What does the notation 'Yij' represent in the context of the script?
-In the script, 'Yij' represents the individual observation in group i, observation number j. It is used to denote a specific data point within a particular group.
What is meant by 'variance between diets' or 'mean square between' in the one-way ANOVA?
-The 'variance between diets' or 'mean square between' refers to the sum of squares between groups divided by their degrees of freedom, which represents the variability that is explained by the different diets in the study.
How is the 'sum of squares within groups' calculated in the one-way ANOVA?
-The 'sum of squares within groups' is calculated by summing the squared differences between each individual observation and its group mean, then dividing by the degrees of freedom within (which is the total number of observations minus the number of groups).
What is the F statistic in the context of the one-way ANOVA test?
-The F statistic is the ratio of the mean square between groups to the mean square within groups. It is used to determine whether the variance between group means is significantly larger than the variance within groups.
What does a high F statistic value indicate in the context of the one-way ANOVA test?
-A high F statistic value indicates that there is a significant amount of variability explained by the differences between the groups, providing evidence against the null hypothesis and in favor of the alternative hypothesis.
How is the p-value used in the interpretation of the one-way ANOVA test results?
-The p-value indicates the probability of observing the test statistic (or one more extreme) if the null hypothesis is true. A small p-value (typically ≤ 0.05) suggests strong evidence to reject the null hypothesis.
What is the F distribution and why is it important in the context of the one-way ANOVA test?
-The F distribution is a continuous probability distribution that arises when the ratio of two independent chi-squared variables is taken. It is important in the one-way ANOVA test because the F statistic follows this distribution, and the degrees of freedom for both the numerator and the denominator are used to determine the p-value.
Why is it necessary to compare all possible pairwise means after conducting a one-way ANOVA test?
-After conducting a one-way ANOVA test, it is necessary to compare all possible pairwise means to identify which specific groups differ from each other. The ANOVA test only tells us if at least one group is different, not which ones.
Outlines
📊 Building the Test Statistic for One-Way ANOVA
This paragraph introduces the process of constructing the test statistic for one-way analysis of variance (ANOVA). The scenario involves comparing weight loss across four different diets, with the null hypothesis that all diets have the same mean weight loss and the alternative hypothesis that at least one diet differs. The explanation delves into the partitioning of total variability into 'explained' (variance between diets) and 'unexplained' (variance within groups) components. Key notations such as group indices, observation numbers, group means, overall mean, standard deviations, and sample sizes are defined. The paragraph explains the calculation of the mean square between and within groups, emphasizing the importance of comparing these two values to build the F-test statistic, which is central to ANOVA.
🔍 Interpreting the F-Statistic in ANOVA
The second paragraph discusses the interpretation of the F-statistic in the context of ANOVA. It explains the expectation of the F-statistic's value under both the null and alternative hypotheses. If the alternative hypothesis is true and at least one mean differs, the mean square between groups is expected to be larger than the mean square within groups, leading to an F-statistic greater than 1. Conversely, under the null hypothesis of equal means, the F-statistic is expected to be approximately 1. The paragraph provides a practical example, calculating an F-statistic of 6.1 from the given data, which strongly suggests that the null hypothesis can be rejected in favor of the alternative. It also touches on the F-distribution, which the F-statistic follows, and the significance of the p-value, which in this case is 0.0011, indicating a very low probability of observing such an F-statistic if the null hypothesis were true. The paragraph concludes with the decision to reject the null hypothesis and the implication that at least one diet is different from the others, with a subsequent discussion on pairwise comparison of means to identify which diets differ.
Mindmap
Keywords
💡One-way analysis of variance
💡Null hypothesis
💡Alternative hypothesis
💡Total variability
💡Variance between diets
💡Degrees of freedom
💡Mean square within groups
💡F statistic
💡F distribution
💡P-value
💡Pairwise comparison
Highlights
Building the test statistic for one-way analysis of variance (ANOVA).
Comparing weight loss across four different diets A, B, C, or D.
Reviewing the example with observations and summary statistics.
Understanding the null hypothesis assuming equal means and the alternative hypothesis.
Explaining the concept of total variability and its separation into explained and unexplained parts.
Notation explanation for groups, observations, means, standard deviations, and sample sizes.
Calculating the variance between diets and its degrees of freedom.
Sum of squares between groups and its significance in the ANOVA test.
Describing the unexplained variability within groups and its calculation.
Comparing the mean square between and within groups to build the F statistic.
The expectation of the F statistic being larger than 1 if the alternative hypothesis is true.
Interpreting the F statistic under the null hypothesis of equal means.
Calculating the F statistic for the given data set and its value.
Understanding the F distribution and its degrees of freedom.
Interpreting the p-value and its significance in hypothesis testing.
Evidence against the null hypothesis based on a low p-value.
The practical application of ANOVA in determining which diets differ from others.
Introduction to pairwise comparison of means as a next step.
Transcripts
Browse More Related Video
ANOVA (Analysis of Variance) and Sum of Squares | Statistics Tutorial #26 | MarinStatsLectures

Excel - One-Way ANOVA Analysis Toolpack

One Way ANOVA

ANOVA: One-way analysis of variance

One way ANOVA using Excel(one way anova)(ANOVA)(anova)(excel)(EXCEL)
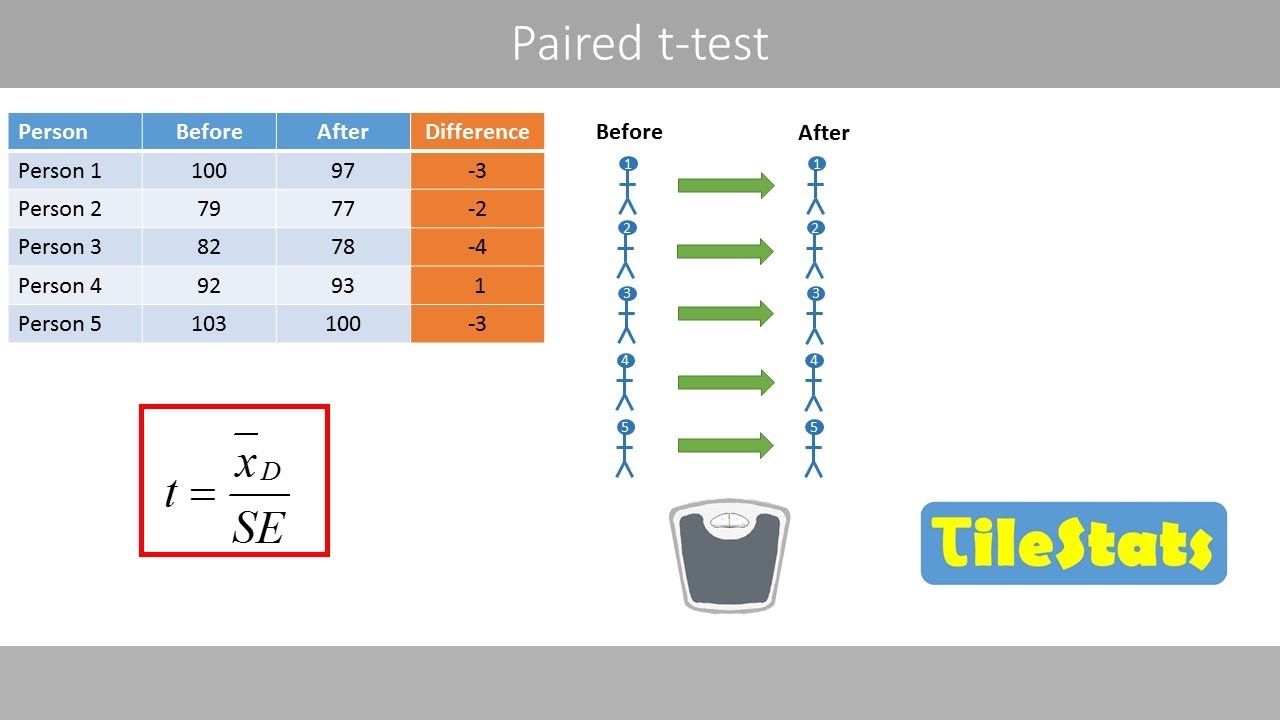
The paired t-test | explained with a simple example
5.0 / 5 (0 votes)
Thanks for rating: