Measures of Dispersion (Grouped Data) | Basic Statistics
TLDRThis instructional video teaches viewers how to calculate the range, variance, and standard deviation for grouped data. It explains the concept of class boundaries and demonstrates the process step-by-step, including finding the mean (average), class marks, and the formula for variance. The video simplifies complex statistical concepts, making them accessible for those new to the topic. It concludes with a practical example, guiding viewers through the calculations to estimate the variance and standard deviation, and encourages further engagement by inviting viewers to subscribe and suggest math topics.
Takeaways
- 📊 The video provides a tutorial on calculating the range, variance, and standard deviation for grouped data.
- 🔢 Grouped data lacks individual data points, making it necessary to estimate these statistical measures by using class boundaries and midpoints.
- 📉 To find the range of grouped data, calculate the difference between the highest upper class boundary and the lowest lower class boundary.
- 📈 The formula for variance in grouped data involves summing the product of frequency and the square of the difference between the class mark and the mean, divided by the total frequency minus one.
- 🧮 The mean (average) of the grouped data is calculated by summing the product of frequency and class mark, then dividing by the total frequency.
- 📚 The class mark is the midpoint of the class interval, which represents the group in calculations.
- 📝 The process involves creating additional columns for class boundaries, frequency times class mark (FX), and the sum of these products.
- ➗ To calculate variance, the sum of the product of frequency and the square of the difference between the class mark and the mean is divided by the total frequency minus one.
- 📉 The standard deviation is the square root of the variance, providing a measure of the dispersion of the data points around the mean.
- 🔍 The video emphasizes that calculations for grouped data are estimations and may not reflect the exact values due to the nature of grouped data.
- 👍 The presenter encourages viewers to subscribe and suggest math topics for future videos.
Q & A
What is the main topic of the video?
-The main topic of the video is teaching how to find the range, variance, and standard deviation of a group of data.
What is the problem with group data as compared to ungrouped data?
-The problem with group data is that it does not provide the exact individual data points, making it difficult to determine the real data values since the data is already organized into groups.
What is meant by 'class boundary' in the context of the video?
-In the context of the video, 'class boundary' refers to the lower and upper limits of a group, adjusted by subtracting 0.5 from the lower limit and adding 0.5 to the upper limit to create a range for each group.
How is the range of group data calculated differently from ungrouped data?
-The range of group data is calculated by finding the highest upper class boundary and subtracting the lowest lower class boundary, rather than simply subtracting the lowest value from the highest in ungrouped data.
What is the formula for calculating the variance of group data?
-The formula for variance of group data, denoted as s squared, is the sum of the product of frequency and the square of the difference of X (class mark) and V (mean), divided by the total frequency minus one.
How do you find the mean (V) of group data?
-To find the mean of group data, you calculate the sum of the product of frequency and the class mark (FX), and then divide by the total frequency (N).
What are 'class marks' in the context of group data?
-Class marks are the representative values for each group, typically calculated as the midpoint or the average of the lower and upper limits of the group.
What is the purpose of calculating the sum of F times X (FX)?
-The sum of F times X (FX) is used to find the total weighted sum of the class marks, which is necessary for calculating the mean and variance of the group data.
How do you calculate the standard deviation from the variance?
-The standard deviation is calculated by taking the square root of the variance.
What is the significance of finding the variance and standard deviation of group data?
-The variance and standard deviation provide insights into the spread of the data, indicating how much the data points vary from the mean, which is useful for statistical analysis and making inferences.
Why is it important to round off the variance when calculating the standard deviation?
-Rounding off the variance simplifies the calculation of the standard deviation and ensures that the result is close to the actual value, without significant impact on the accuracy due to the minimal difference caused by rounding.
Outlines
📊 Introduction to Group Data Analysis
The video script begins with an introduction to the concepts of range, variance, and standard deviation in the context of group data. The presenter explains the limitations of working with grouped data, where specific individual data points are unknown, and the data is presented in ranges with corresponding frequencies. The script outlines the process of creating a class boundary column to facilitate the calculation of the range for grouped data, which involves adjusting the lower and upper limits of each group. The presenter then introduces the formula for calculating the range of grouped data, which is the difference between the highest upper class boundary and the lowest lower class boundary, exemplified with a specific calculation resulting in a range of 15.
🔢 Calculating Variance and Standard Deviation for Grouped Data
This paragraph delves into the process of calculating the variance and standard deviation for grouped data. The presenter first explains the need to calculate the mean (denoted as 'V') of the grouped data by finding the class mark (the midpoint of each range) and then multiplying each by its respective frequency to find the sum of 'F times X'. The sum of frequencies (denoted as 'N') is also calculated. The mean is then used to find the difference between each class mark and the mean, which is squared and multiplied by the frequency to find the sum required for the variance formula. The variance is calculated by dividing this sum by the total frequency minus one, and the standard deviation is found by taking the square root of the variance. The presenter emphasizes that these calculations provide an estimation rather than an exact value due to the nature of grouped data.
📐 Final Calculations and Conclusion
The final paragraph of the script concludes the process of calculating the variance and standard deviation for grouped data. The presenter demonstrates the calculation of the sum of the product of frequency and the square of the difference between the class mark and the mean, which is then used to determine the variance. The variance is calculated by dividing this sum by the total frequency minus one, resulting in an approximate value of 14.11. The standard deviation is then found by taking the square root of this variance, yielding a value of approximately 3.76. The presenter rounds off the values to two decimal places for simplicity and concludes by encouraging viewers to subscribe to the channel and suggest math topics for future videos.
Mindmap
Keywords
💡Range
💡Variance
💡Standard Deviation
💡Frequency
💡Class Boundary
💡Mean
💡Class Mark
💡Summation
💡Grouped Data
💡Estimation
Highlights
Introduction to the process of finding range, variance, and standard deviation for grouped data.
Explanation of the limitations of grouped data due to the lack of specific individual data points.
Demonstration of calculating the range for grouped data by using class boundaries.
Description of the class boundary calculation method, including adjustments to lower and upper limits.
Formula for the range of grouped data, emphasizing the difference between the highest upper class boundary and the lowest lower class boundary.
Introduction to variance and standard deviation calculations for grouped data, highlighting the differences from ungrouped data calculations.
Explanation of the formula for variance, including the sum of the product of frequency and the square of the difference of X and the mean, divided by the total frequency minus one.
The importance of calculating the mean (average) for grouped data using class marks.
Method for finding the class mark, which represents the middle of the data range for each group.
Process of calculating the sum of F times X (frequency times the class mark) to find the total sum.
Calculation of the mean using the sum of F times X divided by the total frequency.
Introduction of the next steps involving the calculation of X minus the mean for each class mark.
Demonstration of squaring the differences between each class mark and the mean to prepare for variance calculation.
Multiplication of frequency by the square of the difference between X and the mean to find the product for variance calculation.
Summation of the products to find the total sum needed for the variance formula.
Final calculation of variance using the total sum of products and the total frequency minus one.
Conversion of variance to standard deviation by taking the square root of the variance value.
Emphasis on the estimation nature of variance and standard deviation calculations for grouped data due to the lack of exact individual data points.
Conclusion and call to action for viewers to subscribe and comment on the channel for further math topic requests.
Transcripts
Browse More Related Video
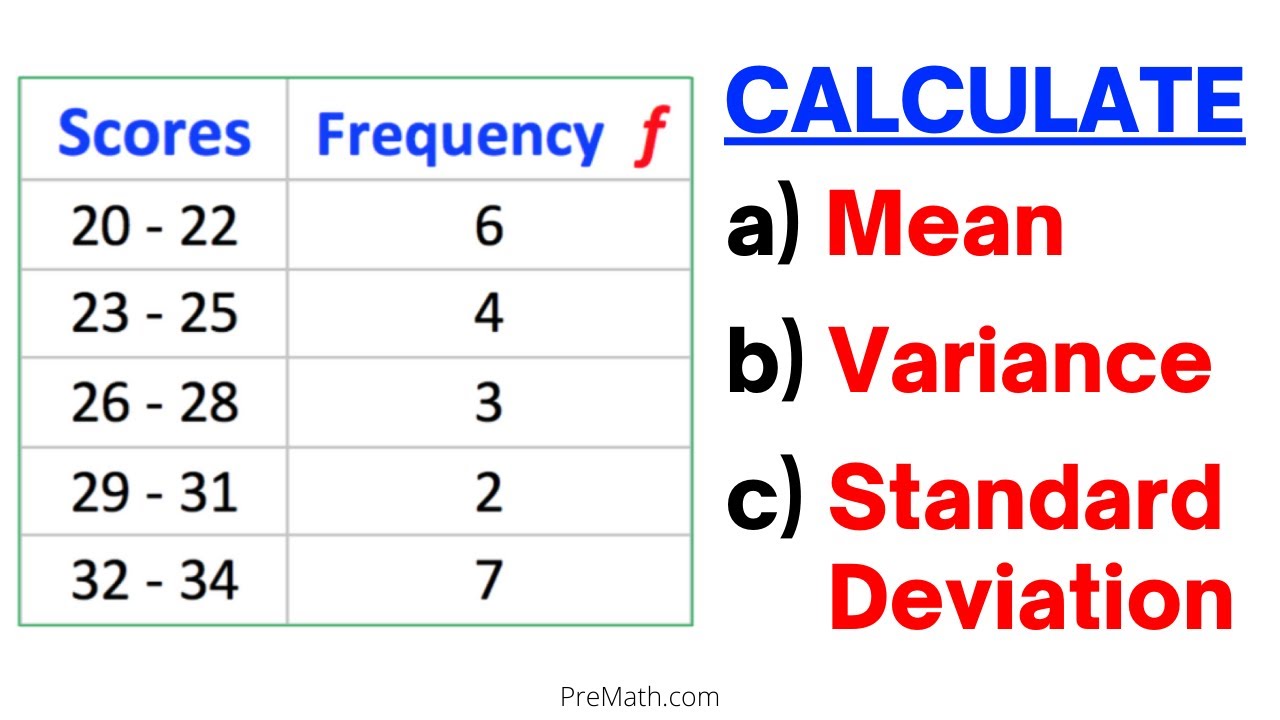
Can You Find Mean, Variance, & Standard Deviation of a Frequency Grouped DataTable? Simple Tutorial
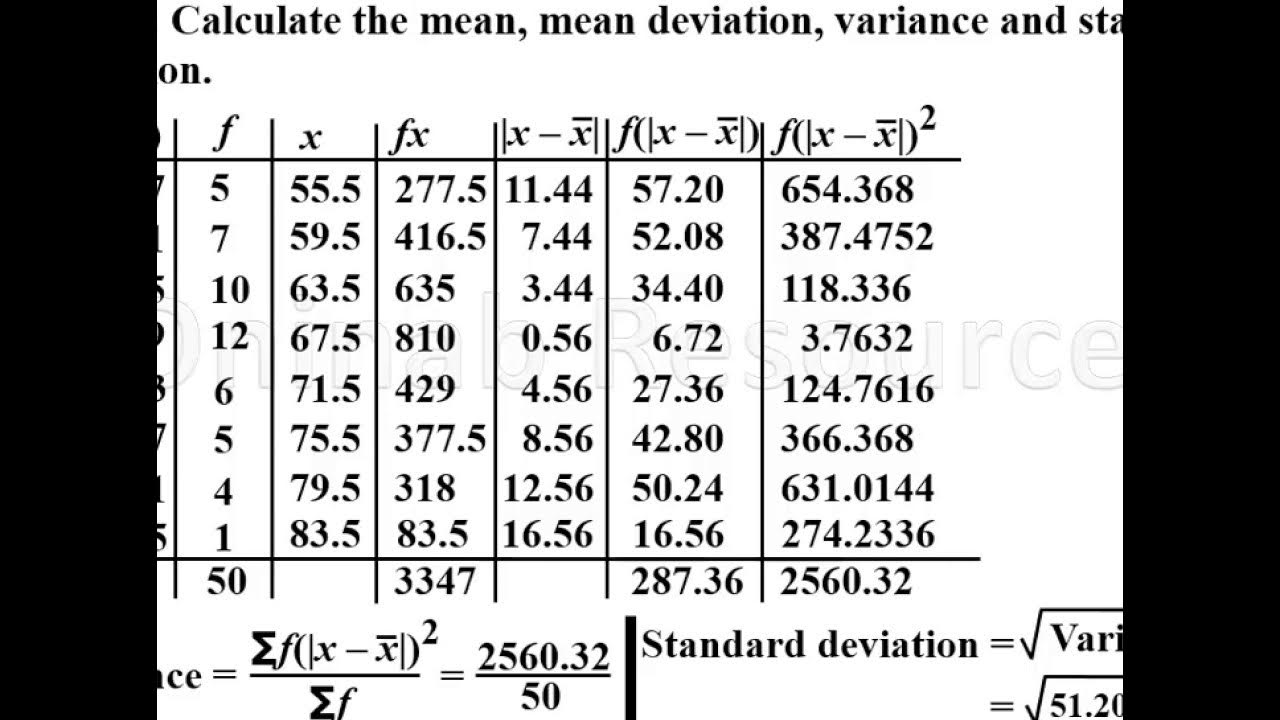
Mean deviation, variance and standard deviation of grouped data.
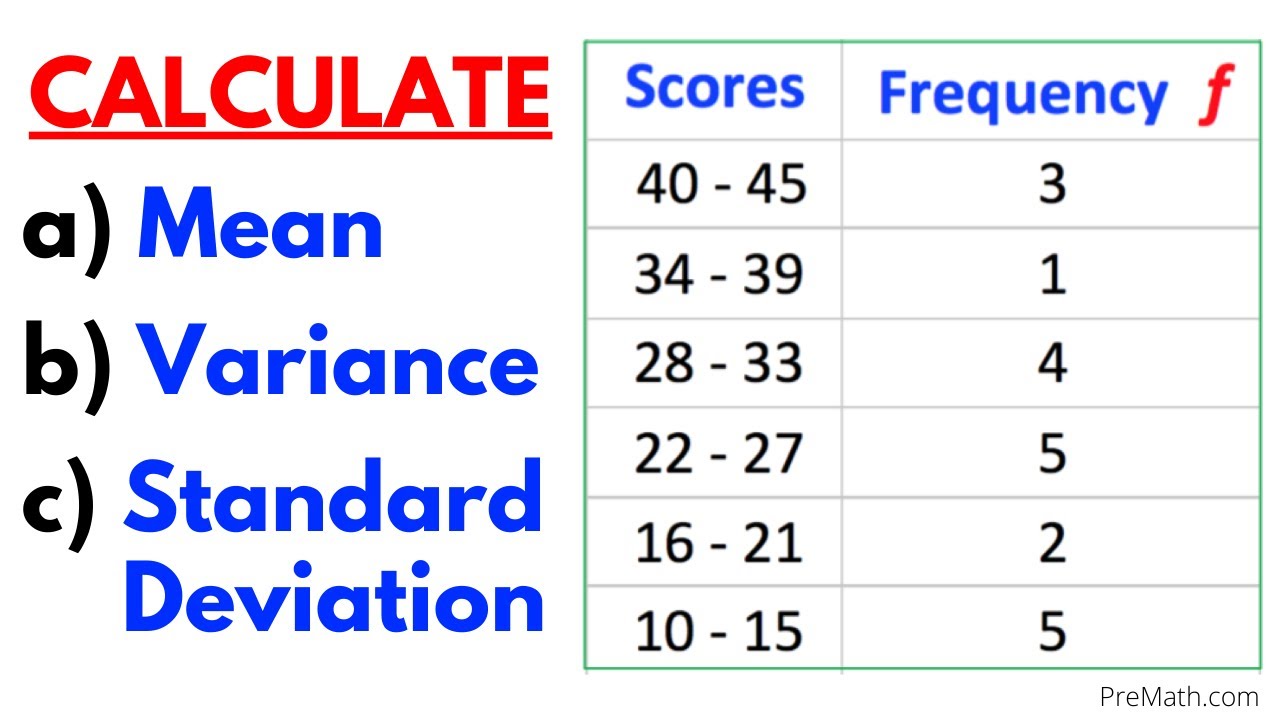
Find the Mean, Variance, & Standard Deviation of Frequency Grouped Data Table| Step-by-Step Tutorial
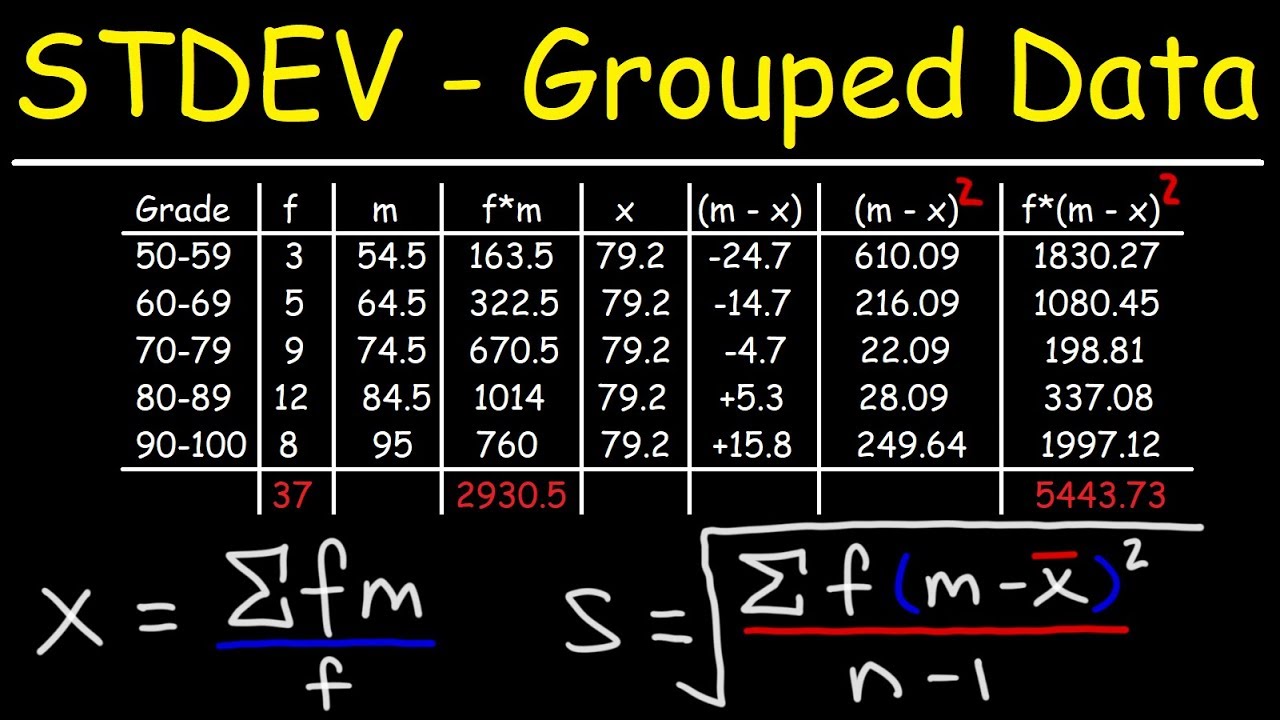
How To Calculate The Standard Deviation of Grouped Data
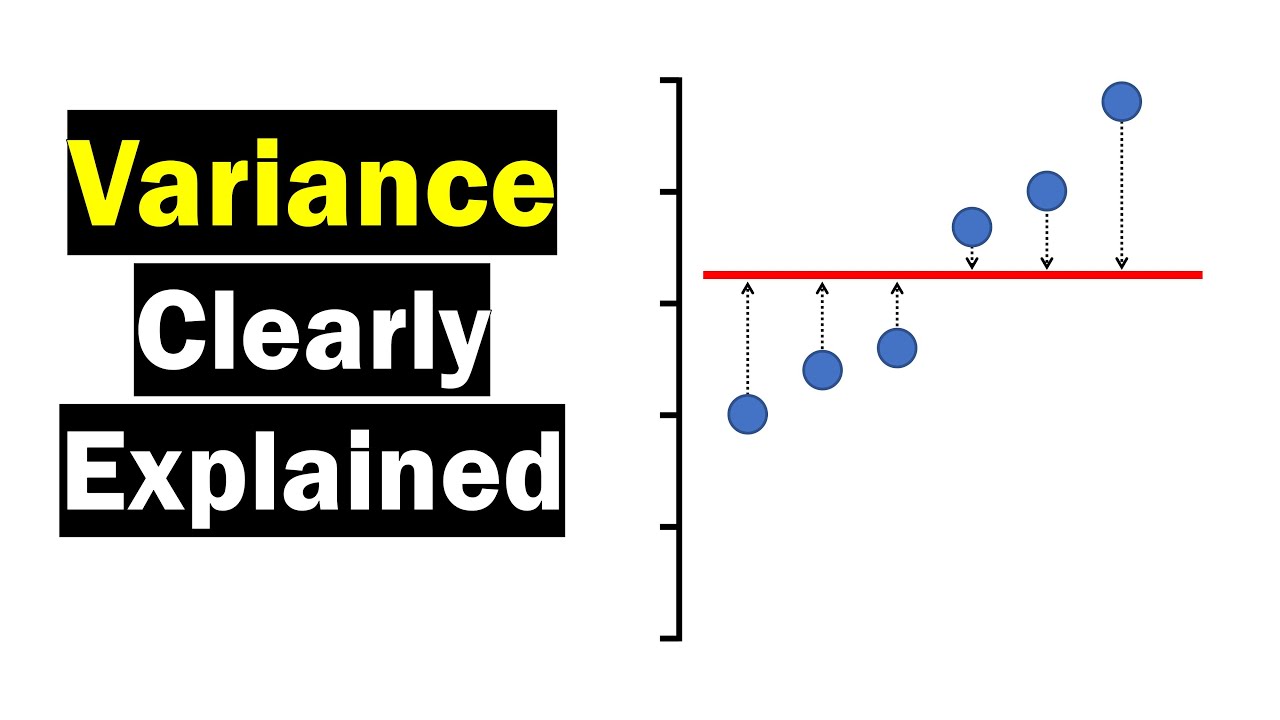
Variance - Clearly Explained (How To Calculate Variance)
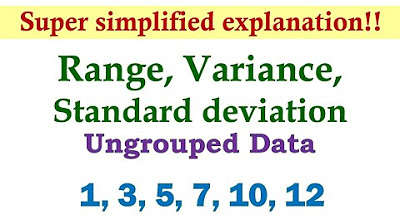
Measures of Dispersion (Ungrouped Data) | Basic Statistics
5.0 / 5 (0 votes)
Thanks for rating: