9.2.2 Two Means, Independent Samples - The Rationale Behind The Equivalent Methods, P-value Method
TLDRThis video script delves into statistical analysis, specifically testing claims about two means using the P Value method. It assumes unknown and unequal population standard deviations and introduces equivalent methods for hypothesis testing. The script explains the rationale behind the P Value, critical Value, and confidence interval methods, focusing on the sampling distribution of sample means and the student T distribution. An example involving the impact of color on creativity illustrates the step-by-step process of hypothesis testing, from formulating hypotheses to calculating the test statistic and P value, ultimately leading to a conclusion about the original claim.
Takeaways
- 📚 The video discusses learning outcome number two of lesson 9.2, focusing on testing a claim about two means using the P Value method with unknown population standard deviations.
- 📉 The P Value method, critical Value method, and confidence interval method are equivalent for testing claims about sample means when the population standard deviations are unknown and not assumed to be equal.
- 📝 The rationale behind these methods is based on the sampling distribution of the difference between two sample means, which is approximately normal under certain conditions.
- 🧐 The mean of the sampling distribution of sample means is equal to the true population mean, making it an unbiased estimator.
- 📊 The standard deviation of the sampling distribution of the sample means (also known as the standard error of the mean) is calculated using the population standard deviation divided by the square root of the sample size.
- ⚖️ The video explains the notation and terminology used for inferences about means with independent samples, including population means, sample means, population standard deviations, sample standard deviations, and sample sizes.
- 🔢 The variance of the difference between two independent random variables is equal to the sum of their variances, which is key in calculating the standard deviation of the difference between sample means.
- 📉 The video outlines the procedure for testing claims about two means using the P Value method, including checking requirements, writing hypotheses, identifying or computing sample statistics, and graphing the sampling distribution.
- 🤔 The importance of graphing the sampling distribution is emphasized to visually assess the significance of the difference between sample means in the context of the null hypothesis.
- 📊 The test statistic T is computed using the difference between sample means and an estimate of the standard deviation of the sample means, which involves the sample variances and sizes.
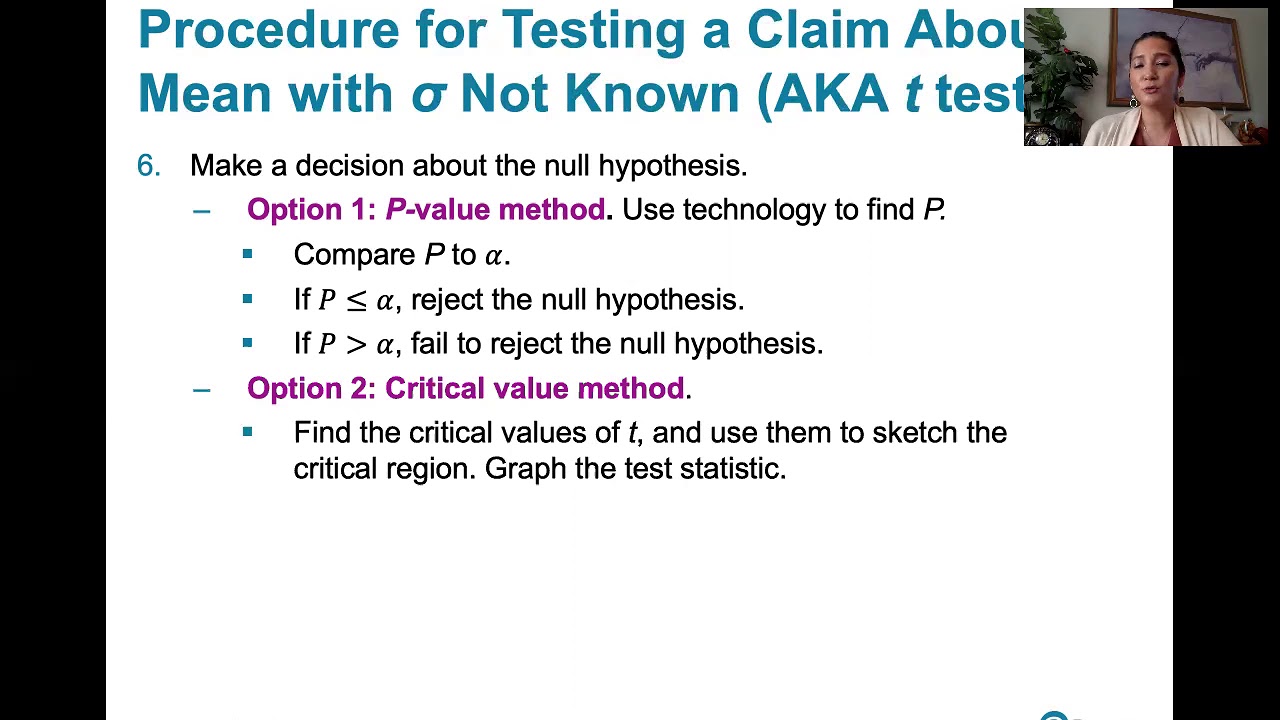
- 🔑 The P Value method involves comparing the P value to the significance level (Alpha) to make a decision about the null hypothesis, with a low P value indicating strong evidence against the null hypothesis.
Q & A
What is the main focus of the video script?
-The video script focuses on explaining the process of testing a claim about two means using sample data from two independent samples, with a specific emphasis on the P Value method, assuming unknown and unequal population standard deviations.
Why is it necessary to discuss the distribution of the difference between two sample means?
-Discussing the distribution of the difference between two sample means is necessary to understand how to test claims about the differences between population means, as it forms the basis for hypothesis testing and statistical inference in this context.
What are the conditions under which the sampling distribution of sample means tends to have a normal distribution?
-The sampling distribution of sample means tends to have a normal distribution under certain conditions, which typically include a sufficiently large sample size (usually n > 30) or when the population from which the sample is drawn has a normal distribution.
What is the significance of the mean of the sampling distribution of sample means being equal to the population mean?
-The mean of the sampling distribution of sample means being equal to the population mean indicates that the sample mean is an unbiased estimator of the population mean, which is a desirable property in statistical estimation.
How is the standard deviation of the sampling distribution of the difference between two sample means calculated?
-The standard deviation of the sampling distribution of the difference between two sample means is calculated as the square root of the sum of the variances of the individual sample means, which is derived from the population standard deviations divided by the square root of the respective sample sizes.
What is the rationale behind using the student T distribution for hypothesis testing in this context?
-The student T distribution is used for hypothesis testing when the population standard deviations are unknown and the sample sizes are relatively small, as it accounts for the increased variability in the estimates of the population means from the samples.
Why are the P Value method, the critical Value method, and the confidence interval method considered equivalent for testing claims about means?
-These methods are considered equivalent for testing claims about means because they all use the same estimate of the standard error of the mean and lead to the same decision regarding the null hypothesis, although they may use different approaches to reach that decision.
What is the difference between using a conservative estimate and the exact value of degrees of freedom when computing P values or critical values?
-Using a conservative estimate of degrees of freedom (the minimum of n-1 for each sample) makes the hypothesis test less likely to reject the null hypothesis compared to using the exact value of degrees of freedom, which is calculated using a specific formula involving the sample variances and sizes.
How does the shape of the student T distribution change with increasing sample size?
-As the sample size increases, the shape of the student T distribution becomes closer to that of the standard normal distribution, with less variability and a standard deviation approaching 1.
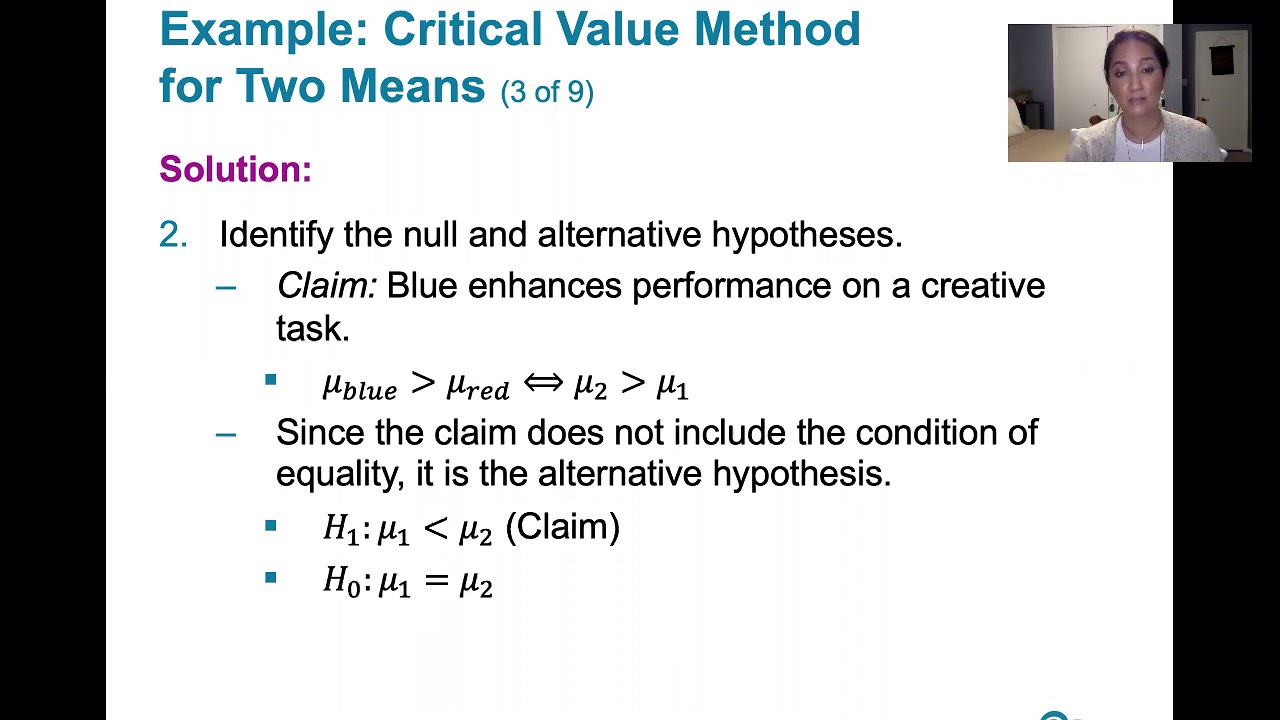
What is the conclusion of the example provided in the script regarding the effect of color on creativity?
-The conclusion of the example is that there is sufficient evidence to support the claim that a blue background enhances performance on a creative task, based on the P Value method and a significance level of 0.01.
Outlines
🔍 Introduction to Hypothesis Testing for Two Means
This paragraph introduces the topic of hypothesis testing for two population means using sample data from two independent groups. The focus is on the P Value method, assuming unknown and unequal population standard deviations. The speaker outlines equivalent methods for testing claims about sample means and promises to explain the rationale behind different testing procedures, including the P Value, critical Value, and confidence interval methods. The importance of understanding the sampling distribution of sample means and the conditions under which this distribution can be considered normal is emphasized.
📚 Understanding the Sampling Distribution of Sample Means
The paragraph delves into the concept of the sampling distribution of the difference between two sample means, highlighting that it is approximately normal under certain conditions. It explains the mean and standard deviation of this distribution, noting that the mean of the sample means is equal to the population mean, making it an unbiased estimator. The standard deviation of the sampling distribution, represented by Sigma x-bar, is derived from the population standard deviation and sample size. The paragraph also introduces notation for statistical inference with independent samples, including population and sample statistics for both groups.
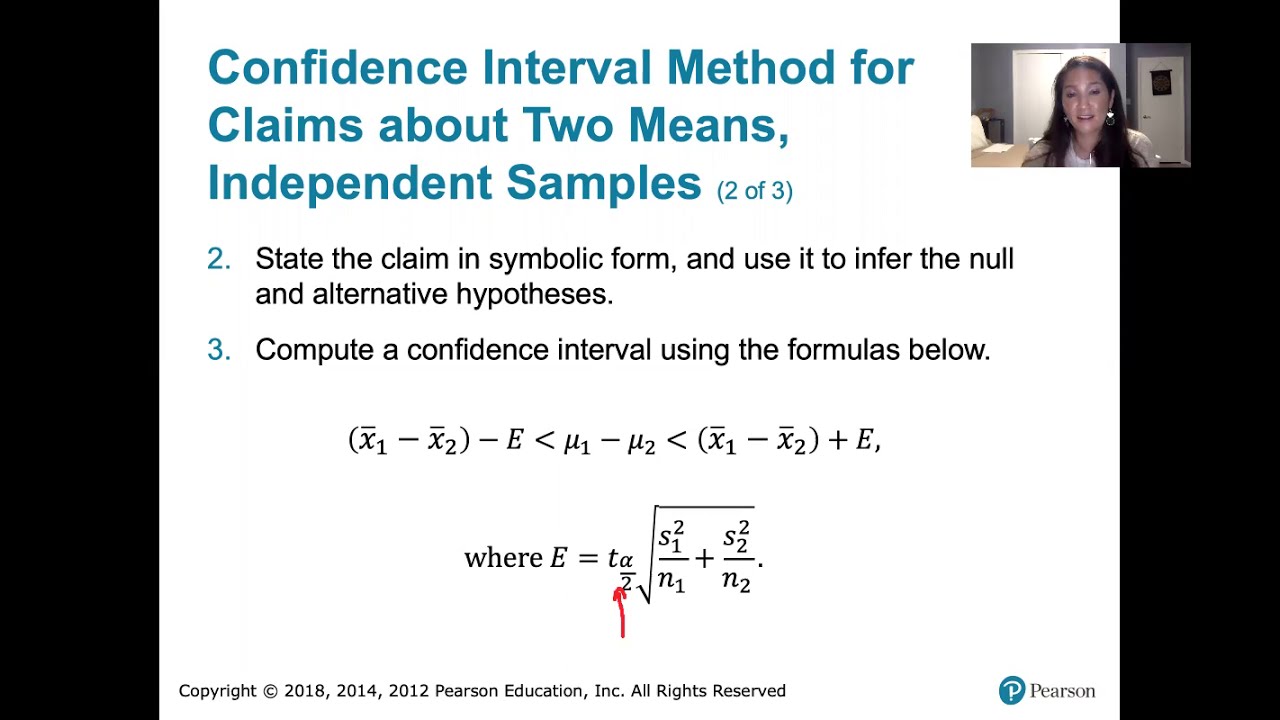
📉 Equivalence of Testing Methods for Means
The speaker discusses the equivalence of the P Value, critical Value, and confidence interval methods when testing claims about two means. They explain that these methods use the same standard error of the mean for calculating the test statistic T, leading to the same conclusions. The paragraph also clarifies that while the P Value and critical Value methods use the same test statistic and thus yield the same results, the confidence interval method is slightly different but still arrives at the same conclusion due to the use of the same standard deviation estimate in the margin of error.
📝 Procedure for Testing Claims About Two Means
This paragraph outlines the procedure for testing a claim about two means using the P Value method, which also applies to the critical Value method initially. It starts with checking the requirements for using these methods, such as having unknown and unequal population standard deviations, independent and random samples, and either large sample sizes or normal population distributions. The steps include writing the claim in symbolic form to infer the null and alternative hypotheses, identifying or computing sample sizes, means, and standard deviations, and graphing the sampling distribution of the difference between sample means under the null hypothesis.
📊 Computing the Test Statistic for Hypothesis Testing
The paragraph explains how to compute the test statistic T for hypothesis testing when the null hypothesis is assumed to be true. It details the process of converting the difference between sample means into a T score using the estimated standard deviation, which accounts for the unknown population standard deviations. The speaker emphasizes using technology for computation and describes the transition from the distribution of the difference between sample means to the student T distribution, which is necessary for determining if the sample statistic is significantly high or low.
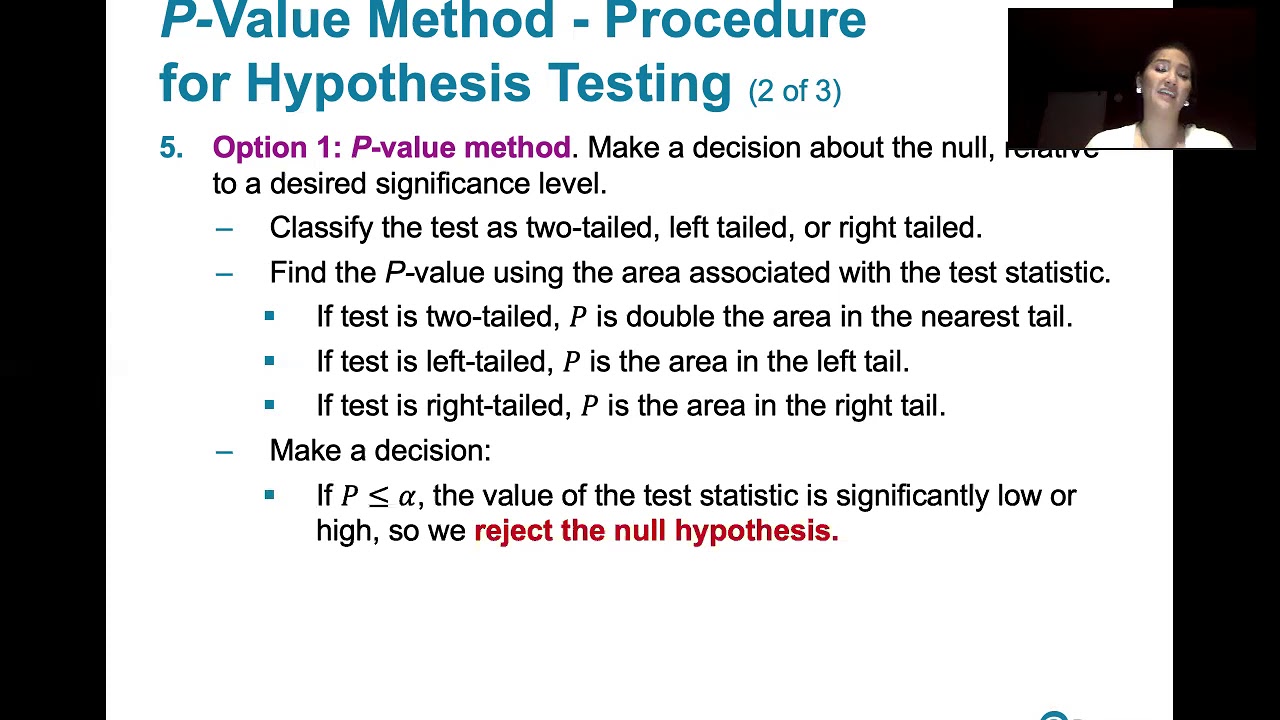
🤔 Decision Making Using P Values and Critical Values
The speaker contrasts the P Value method and the critical Value method after the test statistic T has been computed. The P Value method involves classifying the test as one-tailed or two-tailed, finding the P value associated with the test statistic, and making a decision about the null hypothesis by comparing the P value to the significance level Alpha. If the P value is less than or equal to Alpha, the null hypothesis is rejected, indicating the sample statistic is significantly different from what would be expected under the null hypothesis. The conclusion about the original claim is then stated in non-technical terms.
📉 Characteristics and Degrees of Freedom of the Student T Distribution
This paragraph provides a recap of the characteristics of the student T distribution, including its shape, mean, and standard deviation, which is larger than one due to the increased variability with smaller sample sizes. The degrees of freedom associated with the test statistic are discussed, with a conservative estimate being the minimum of one less than the sample sizes of the two groups. The exact number of degrees of freedom is also explained, which is more precise and generally higher than the conservative estimate, affecting the likelihood of correctly rejecting or failing to reject the null hypothesis.
📝 Application of the P Value Method to a Research Example
The speaker applies the P Value method to a research example where the effect of color on creativity is investigated. The researchers claim that a blue background enhances performance on a creative task. The procedure involves checking the requirements for the test, identifying the null and alternative hypotheses, computing the sample statistics, and graphing the sampling distribution under the null hypothesis. The test statistic T is computed, and the P value is determined using either a conservative or exact estimate of the degrees of freedom. The results are then used to make a decision about the null hypothesis.
🔢 Calculation of the Test Statistic and P Value in Excel
The paragraph demonstrates the calculation of the test statistic and P value using Excel. The speaker includes the summary statistics and computes the necessary components such as A and B, which represent the estimates of variance for each sample. The test statistic T is calculated using the formula provided. The exact number of degrees of freedom is determined using a specific formula, and the P value is found using the T.DIST function in Excel, which requires the test statistic, degrees of freedom, and the cumulative parameter set to TRUE for the left-tail area.
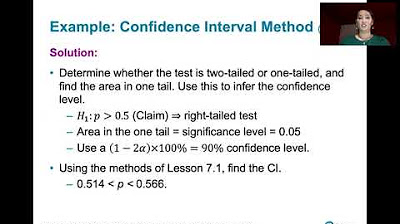
📉 Interpretation of the P Value and Conclusion for the Research Example
The speaker interprets the P values obtained from Excel calculations, comparing them to the significance level Alpha of 0.01. Both the conservative and exact estimates of the degrees of freedom yield P values less than Alpha, indicating strong evidence against the null hypothesis. The null hypothesis is rejected, supporting the original claim that a blue background enhances performance on a creative task. The speaker emphasizes the consistency of results between the conservative and exact methods and concludes that the color blue has a significant effect on creativity.
Mindmap
Keywords
💡P Value Method
💡Critical Value Method
💡Confidence Interval Method
💡Hypothesis Testing
💡Null Hypothesis
💡Alternative Hypothesis
💡Sample Mean
💡Population Standard Deviation
💡Student's T-Distribution
💡Degrees of Freedom
💡Significance Level (Alpha)
Highlights
The video discusses the P Value method for testing a claim about two means with independent samples and unknown population standard deviations.
Equivalent methods for testing sample means when the population standard deviations are not known are listed, including the rationale behind the formulas and procedures used.
The rationale for the P Value, critical Value, and confidence interval methods is explained, focusing on the sampling distribution of sample means.
The importance of the sampling distribution of the difference between two sample means is highlighted for statistical inference.
Notation for inferences about means with independent samples is introduced, including population and sample statistics.
The video explains the standard deviation of the difference between sample means and its relation to the variance of the individual samples.
The equivalence of the P Value, critical Value, and confidence interval methods for testing claims about means is discussed.
Procedure for testing a claim about two means using the P Value method is outlined, including checking requirements and writing hypotheses.
The use of technology for computing the test statistic T is suggested for simplicity and accuracy.
The video demonstrates how to graph the sampling distribution of the difference between sample means to visualize the test statistic.
The computation of the test statistic T using the sample means, standard deviations, and sizes is detailed.
The P Value method involves comparing the computed P value to the significance level Alpha to make a decision about the null hypothesis.
Characteristics of the student T distribution are reviewed, including its shape and relationship to the normal distribution.
The concept of degrees of freedom in the context of the student T distribution is explained, with examples of conservative and exact estimates.
The process of finding P values and critical values using Excel and statistical tables is demonstrated.
An example from the University of British Columbia is used to illustrate the application of the P Value method in hypothesis testing.
The conclusion of the example supports the original claim that the color blue enhances performance on a creative task based on the P Value method.
Transcripts
Browse More Related Video
9.2.3 Two Means, Indep. Samples - Critical Value Method, St. Deviations Unknown, Not Assumed Equal
9.2.4 Two Means, Indep. Samples - Confidence Intervals, St. Deviations Unknown, Not Assumed Equal
8.3.1 Testing a Claim About a Mean - With Sigma Not Known, Three Equivalent Methods
8.2.2 Testing a Claim About A Proportion - Confidence Interval Method, Comparison to Other Methods
9.1.1 Two Proportions - Rationale Behind Hypothesis Tests Involving Two Proportions
8.2.1 Testing a Claim About a Proportion - P-value, Critical Value Methods, Normal Approximation
5.0 / 5 (0 votes)
Thanks for rating: