8.3.1 Testing a Claim About a Mean - With Sigma Not Known, Three Equivalent Methods
TLDRThis video script offers an in-depth exploration of statistical methods for testing claims about a population mean when the standard deviation is unknown. It covers the p-value method, critical value method, and confidence interval method, emphasizing their equivalence and reliance on the student t-distribution. The script guides viewers through the process of hypothesis testing, from checking requirements to computing test statistics and making conclusions. It also discusses the robustness of the t-test and provides a step-by-step example using student estimates of one minute, illustrating how to analyze data and interpret results in a non-technical manner.
Takeaways
- 📚 The video discusses three methods for testing a claim about a mean when the population standard deviation is unknown: the critical value method, the p-value method, and the confidence interval method.
- 📉 The student t-distribution is used in all three methods due to its robustness against departures from normality, especially when the sample size is greater than 30 or the population is normally distributed.
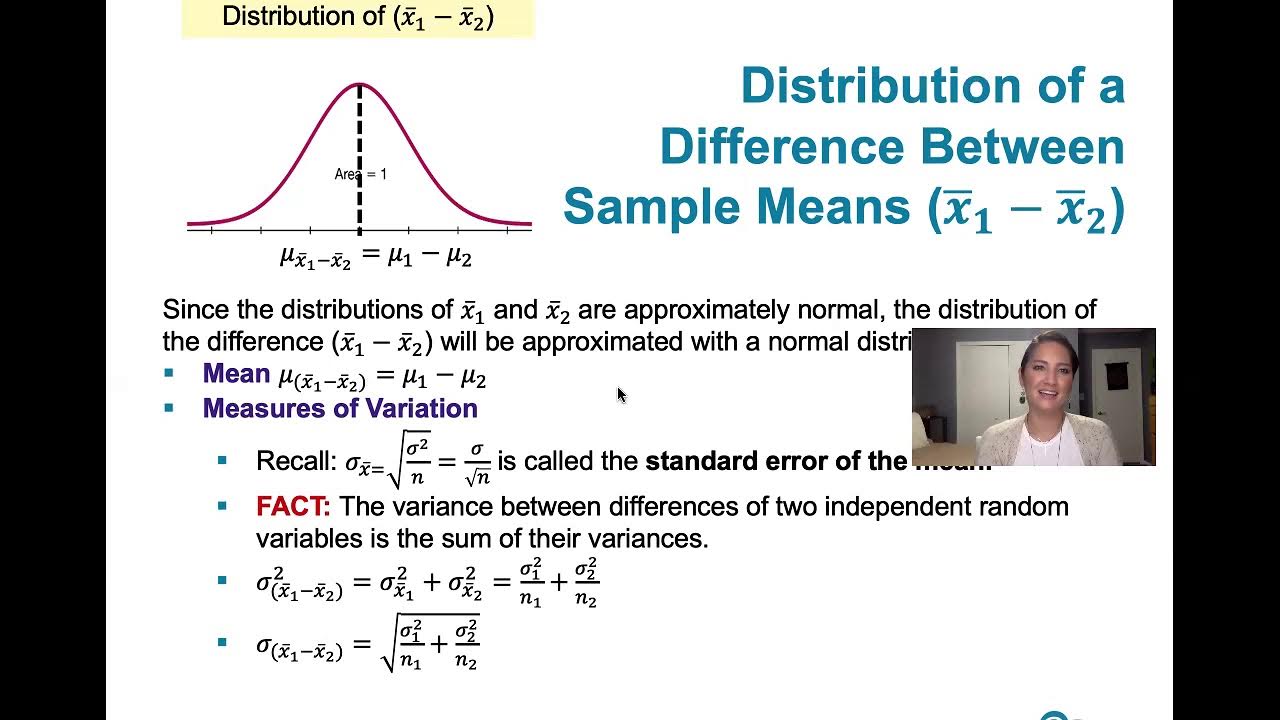
- 🔢 Notation is important: n for sample size, x̄ for sample mean, s for sample standard deviation, σ for population standard deviation, and μ̄x̄ for the mean of the sampling distribution of sample means.
- 📊 The critical value method involves comparing the test statistic to critical t-values from the student t-distribution, which depend on the chosen significance level.
- 🤖 The p-value method requires technology to calculate the probability of observing a test statistic as extreme as the one obtained, or more extreme, assuming the null hypothesis is true.
- 📉 For the p-value method, a p-value less than or equal to the significance level alpha leads to the rejection of the null hypothesis.
- 📈 The critical value method involves comparing the absolute value of the test statistic to the absolute value of the critical t-value; if the test statistic is in the critical region, the null hypothesis is rejected.
- 📝 The confidence interval method constructs an interval estimate of the population mean and compares it to the null hypothesis value to decide whether to reject the null hypothesis.
- 📋 The video emphasizes the importance of stating conclusions in non-technical terms to make the results understandable to a general audience.
- 📚 The video script includes an example problem involving students estimating the length of one minute, demonstrating the application of the t-test and the three methods discussed.
Q & A
What are the three methods discussed in the video for testing a claim about a mean when the population standard deviation is unknown?
-The three methods discussed in the video are the critical value method, the p-value method, and the confidence interval method.
What is the purpose of using the Student t-distribution in these testing methods?
-The Student t-distribution is used because it allows for the testing of a claim about a mean when the population standard deviation is unknown, and it is appropriate when the sample size is small and the population distribution is approximately normal.
What is the significance of the term 'mu sub x bar' in the context of the video?
-Mu sub x bar represents the mean of the sampling distribution of sample means. It is used to describe the central tendency of the distribution of all possible sample means taken from the population.
What is the assumption made about the sampling distribution of the sample means when using the t-test?
-The assumption made is that the sampling distribution of the sample means is approximately normally distributed, especially when the original population is normally distributed, the sample size is greater than 30, or the distribution looks approximately normal.
Why is the t-test considered robust against departure from normality?
-The t-test is considered robust against departure from normality because it works reasonably well even if the population distribution is not perfectly normal, as long as the departure from normality is not too extreme.
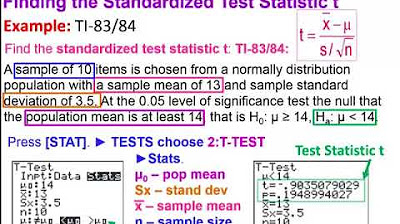
What is the role of the test statistic 't' in hypothesis testing?
-The test statistic 't' is used to determine how significantly different the sample mean is from the population mean assumed in the null hypothesis. It quantifies the number of standard errors away from the hypothesized mean.
What is the p-value and how is it used in hypothesis testing?
-The p-value is the probability of obtaining a test statistic as extreme or more extreme than the one calculated from the sample data, assuming the null hypothesis is true. If the p-value is less than or equal to the significance level (alpha), the null hypothesis is rejected.
How does the critical value method differ from the p-value method?
-The critical value method involves comparing the test statistic to a critical value from the Student t-distribution to determine if the result is significantly high or low. It does not require technology to find the p-value and is used when technology is not available.
What is the concept of 'degrees of freedom' in the context of the Student t-distribution?
-Degrees of freedom in the context of the Student t-distribution refer to the number of independent pieces of information that contribute to the calculation of the test statistic. For a sample, it is typically the sample size minus one.
How are the critical values of t used to make a decision about the null hypothesis?
-The critical values of t define the boundaries of the critical region. If the test statistic falls within the critical region (i.e., beyond the critical values), the null hypothesis is rejected. If it falls outside the critical region, the null hypothesis is not rejected.
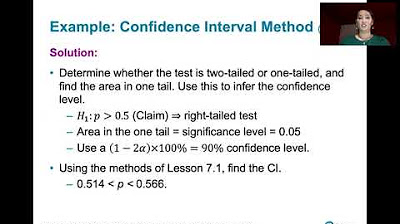
What is the confidence interval method for testing a claim about a mean?
-The confidence interval method involves calculating a range of values within which the population mean is likely to fall with a certain level of confidence. If the value stated in the null hypothesis falls within this interval, the null hypothesis is not rejected; if it falls outside, the null hypothesis is rejected.
Why are the p-value method, the critical value method, and the confidence interval method considered equivalent when testing claims about means?
-These methods are considered equivalent when testing claims about means because they all use the same test statistic (t) and the same estimated standard deviation (s/√n). The critical value of t and the t value used in the confidence interval formula are the same, leading to the same conclusion about the null hypothesis.
Can the methods for testing claims about means be applied to testing claims about proportions?
-No, the methods for testing claims about means should not be applied to testing claims about proportions. The confidence interval method for proportions does not necessarily give the same results as the p-value method or the critical value method for proportions.
What is the significance of the histogram in determining whether the sample data appear to be from a normally distributed population?
-A histogram provides a visual representation of the data distribution. If the histogram shows a bell-shaped curve with symmetry about the center and no significant skewness, it suggests that the data are approximately normally distributed, which is an important assumption for using the t-test.
Outlines
📚 Introduction to Testing a Claim About a Mean
This paragraph introduces the topic of testing a claim about a population mean when the standard deviation is unknown. It outlines three methods for testing the claim: the critical value method, the p-value method, and the confidence interval method. The video aims to help viewers understand that these methods are equivalent and will lead to the same conclusion. Key terms such as sample size, sample mean, sample standard deviation, and population mean are defined, and the importance of the student t-distribution is highlighted for hypothesis testing.
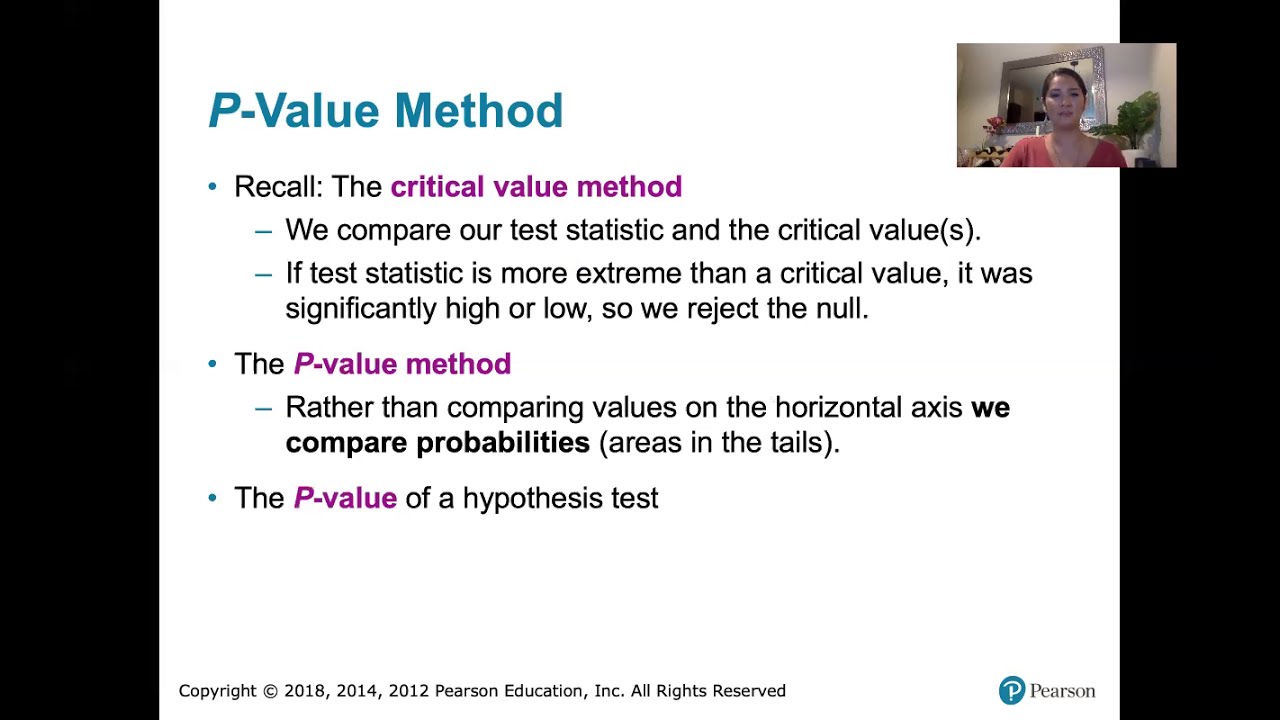
📈 Explaining the P-Value and Critical Value Methods
The paragraph delves into the specifics of the p-value method and the critical value method for hypothesis testing. It explains the notation and concepts involved, such as the sampling distribution of sample means and the test statistic t. The critical value method is also described, including how to find critical values using Table A3. The paragraph emphasizes the need for technology to calculate p-values due to the variability of the student t-distribution with different sample sizes.
📉 Student T-Distribution and Hypothesis Testing
This section provides an overview of the student t-distribution, its characteristics, and how it is used in hypothesis testing. It explains the robustness of the t-test against departures from normality and the conditions under which the t-distribution is appropriate. The paragraph also discusses the procedure for testing a claim about a mean, including checking the requirements, stating the null and alternative hypotheses, and identifying key summary statistics.
🔍 Graphical Analysis and Hypothesis Testing Steps
The paragraph discusses the process of graphically analyzing data to determine if it appears to be from a normally distributed population. It outlines the steps for hypothesis testing, including graphing the sampling distribution of sample means, computing the test statistic, and using the test statistic to make a decision about the null hypothesis. The p-value method and the critical value method are compared, and the importance of stating conclusions in non-technical terms is emphasized.
📝 Computing Sample Mean and Standard Deviation
This paragraph focuses on the computation of the sample mean and sample standard deviation using Excel. It provides a step-by-step guide on how to use Excel functions to calculate these summary statistics, which are essential for hypothesis testing. The explanation includes using the SUM and AVERAGE functions for the sample mean, and the STDEV.S function for the sample standard deviation.
📉 Graphing the Sampling Distribution and Test Statistic
The paragraph describes the process of graphing the sampling distribution of the sample means and plotting the test statistic within this distribution. It explains how to determine if the sample mean is significantly high or low by comparing it to the critical values or p-values. The concept of degrees of freedom is introduced, and its importance in choosing the correct student t-distribution is discussed.
🔢 Hypothesis Testing Using P-Value and Critical Value Methods
This section explains how to use the p-value method and the critical value method to make a decision about the null hypothesis. It details the process of finding the p-value using Excel functions and comparing it to the significance level. The critical value method is also described, including how to use Table A3 to find the critical values of t and determine the critical region.
📊 Confidence Interval Method for Hypothesis Testing
The paragraph introduces the confidence interval method for testing claims about a mean. It outlines the steps for computing a confidence interval using the student t-distribution and explains how to use the interval to make a decision about the null hypothesis. The importance of ensuring the sample data meets the requirements for normal approximations is emphasized.
🔗 Equivalence of Hypothesis Testing Methods
This final paragraph highlights the equivalence of the three hypothesis testing methods—p-value, critical value, and confidence interval—when testing claims about means. It explains that the same test statistic and critical values are used across methods, leading to consistent results. The paragraph also notes that this equivalence does not hold for testing claims about proportions.
Mindmap
Keywords
💡Claim
💡Population Standard Deviation
💡Sample Mean (x̄)
💡Student t-Distribution
💡Hypothesis Testing
💡Null Hypothesis (H0)
💡Alternative Hypothesis (H1 or Ha)
💡P-Value
💡Critical Value
💡Confidence Interval
💡Degrees of Freedom
💡Significance Level (α)
Highlights
The video discusses three methods for testing a claim about a mean when the population standard deviation is unknown: the critical value method, the p-value method, and the confidence interval method.
All three methods utilize the Student t-distribution, emphasizing the equivalence and consistency of conclusions drawn from each method.
The p-value method and the critical value method are introduced, with the latter sometimes referred to as the traditional or classical method.
Key notations are defined, including sample size (n), sample mean (x̄), sample standard deviation (s), and population standard deviation (σ).
The importance of understanding the sampling distribution of sample means and its relation to the population mean is highlighted.
The t-test is described as robust against departure from normality, meaning it works well even if the distribution is not perfectly normal.
The procedure for testing a claim about a mean is outlined, including checking requirements, stating hypotheses, and identifying summary statistics.
The p-value method requires technology to find the area in the tails of the Student t-distribution and compare it to the significance level alpha.
The critical value method uses Table A3 to find the critical t-values for a given significance level and degrees of freedom.
The confidence interval method is explained, which involves computing a confidence interval using the Student t-distribution and comparing it to the null hypothesis.
The video demonstrates using Excel for statistical calculations, including finding the sample mean and standard deviation.
An example problem is presented, where students estimate the length of one minute, and a hypothesis test is conducted to determine if their estimates come from a population with a mean of 60 seconds.
The video shows how to graph the sampling distribution of sample means and identify the critical region for making a decision about the null hypothesis.
The process of failing to reject the null hypothesis is explained, indicating that there is not enough evidence to suggest the null hypothesis is false.
The video concludes by emphasizing the importance of stating conclusions in non-technical terms to make the results understandable to a general audience.
The video also covers the use of technology for hypothesis testing and the importance of checking assumptions before applying statistical tests.
A comparison of the Student t-distribution and the standard normal distribution is provided, illustrating how the t-distribution becomes more normal as the sample size increases.
The concept of degrees of freedom in the context of the Student t-distribution is explained, relating it to the sample size minus one.
Transcripts
Browse More Related Video
9.2.2 Two Means, Independent Samples - The Rationale Behind The Equivalent Methods, P-value Method
8.2.2 Testing a Claim About A Proportion - Confidence Interval Method, Comparison to Other Methods
9.2.3 Two Means, Indep. Samples - Critical Value Method, St. Deviations Unknown, Not Assumed Equal

Explaining The One-Sample t-Test
Elementary Statistics - Chapter 8 - Hypothesis Testing Part 3 Revised
8.1.5 Basics of Hypothesis Testing - P-value Method, and Comparison to the Critical Value Method
5.0 / 5 (0 votes)
Thanks for rating: