8.2.1 Testing a Claim About a Proportion - P-value, Critical Value Methods, Normal Approximation
TLDRThis video tutorial delves into testing statistical claims about proportions using the normal approximation method. It covers the p-value and critical value approaches, explaining the requirements for their application, such as simple random sampling and binomial distribution conditions. The script guides viewers through hypothesis testing steps, including null and alternative hypothesis formulation, sample statistic calculation, and graphical analysis. An example using medical malpractice lawsuits tests the claim that most are dismissed, ultimately rejecting the null hypothesis and supporting the claim with a significant p-value and critical value analysis.
Takeaways
- 📚 The video begins a two-part series on testing claims about proportions, focusing on the normal approximation methods for hypothesis testing.
- 🔍 It discusses two statistical methods: the p-value method and the critical value method, contrasting them with confidence interval methods.
- 📈 The script reviews the notation and concepts necessary for understanding hypothesis testing, such as sample size (n), population proportion (p), and sample proportion (p-hat).
- 🎯 The requirements for using normal approximation methods are outlined, including the need for a simple random sample and conditions for a binomial distribution.
- 📝 The importance of the independence of trials and the constancy of the probability of success across trials is emphasized for binomial distribution assumptions.
- 🔢 The 'n * p' and 'n * q' conditions are explained, which must be greater than or equal to 5 for the normal approximation to be valid.
- ⚖️ The video explains the process of hypothesis testing, including writing hypotheses, identifying the sample statistic, and graphing the sampling distribution.
- 📉 The p-value method is described in detail, showing how to calculate p-values and make decisions based on the significance level (alpha).
- 📊 The critical value method is also explained, demonstrating how to determine critical regions and compare them to the test statistic z.
- 📚 An example is provided using data on medical malpractice lawsuits, illustrating both the p-value and critical value methods to test a claim about the proportion of dismissed cases.
- 🏁 The conclusion of the example shows that there is sufficient evidence to support the claim that most medical malpractice lawsuits are dropped or dismissed, using both testing methods.
Q & A
What are the two main methods discussed in the video for testing a claim about a proportion?
-The two main methods discussed in the video for testing a claim about a proportion are the p-value method and the critical value method.
What is the purpose of the normal approximation in hypothesis testing?
-The purpose of the normal approximation in hypothesis testing is to approximate the sampling distribution of the sample proportions, which allows for the use of z-scores to determine if the sample proportion is significantly different from the population proportion under the null hypothesis.
What are the requirements for using the normal approximation to the binomial distribution?
-The requirements for using the normal approximation to the binomial distribution include: the sample observations must form a simple random sample, the conditions for a binomial distribution must be satisfied (fixed number of trials, two outcomes per trial, trials must be independent, and the probability of success must remain the same across trials), and the product of the sample size and the probability of success (and failure) must be greater than or equal to 5.
What is the notation used for the sample proportion in the video?
-The notation used for the sample proportion in the video is p-hat (p̂), which represents the proportion of successful trials in the sample.
How is the test statistic calculated in the context of the normal approximation to the sampling distribution of the sample proportions?
-The test statistic, represented by z, is calculated by subtracting the population proportion (p) from the sample proportion (p-hat) and dividing by the standard deviation of the sampling distribution of p-hat, which is the square root of (p * q) / n, where q is one minus p, and n is the sample size.
What is a p-value in the context of hypothesis testing?
-A p-value is the probability of obtaining a test statistic as extreme or more extreme than the one calculated from the sample data, assuming the null hypothesis is true. It represents the strength of evidence against the null hypothesis.
What is the significance of the critical value in hypothesis testing?
-The critical value is a z-score that separates typical values of the test statistic from those that are significantly high or low, relative to a desired significance level (alpha). If the test statistic falls beyond the critical value, it indicates a significant result, leading to the rejection of the null hypothesis.
How does the hypothesis testing procedure begin for both the p-value method and the critical value method?
-The hypothesis testing procedure begins with the same four steps for both methods: writing the claim in symbolic form to infer the null and alternative hypotheses, identifying or computing the sample statistic, identifying the sample size, and graphing the sampling distribution of the sample statistic assuming the null hypothesis is true.
What is the difference between a two-tailed test, a left-tailed test, and a right-tailed test in the context of hypothesis testing?
-A two-tailed test considers extreme values in both tails of the distribution, a left-tailed test considers extreme values in the left tail, and a right-tailed test considers extreme values in the right tail. The choice depends on the directionality of the alternative hypothesis relative to the null hypothesis.
Can you explain the process of hypothesis testing using the p-value method as described in the video?
-The process of hypothesis testing using the p-value method involves: determining the test type (two-tailed, left-tailed, or right-tailed), calculating the p-value which is the probability of observing a test statistic as extreme or more extreme than the one calculated if the null hypothesis is true, comparing the p-value to the significance level (alpha), and making a decision to either reject or fail to reject the null hypothesis based on whether the p-value is less than or greater than alpha.
Outlines
📚 Introduction to Normal Approximation Methods
This paragraph introduces the video's focus on testing claims about proportions using two methods of normal approximation: p-value and critical value methods, as well as confidence interval methods. It emphasizes the importance of understanding the requirements for using normal approximation, including the conditions for a binomial distribution, such as a fixed number of trials, two outcomes per trial, independence and equal probability of success across trials. The video also reviews key notations like sample size (n), population proportion (p), sample proportion (p-hat), and probability of failure (q). It sets the stage for testing a claim about a proportion using the normal approximation to the sampling distribution of sample proportions.
📉 Requirements for Normal Approximation and Test Statistic Overview
The paragraph delves into the specific requirements for employing the normal approximation to the binomial distribution, such as ensuring the sample forms a simple random sample and meets the conditions for a binomial distribution. It also discusses the independence of trials and the constancy of the probability of success across trials. The paragraph introduces the concept that n times p and n times q must be greater than or equal to five, which is a condition for the normal approximation to be valid. It further explains the test statistic, p-values, and critical values, setting up the groundwork for hypothesis testing procedures that will be covered in the video.
🔍 Hypothesis Testing Procedure and Decision Making
This section outlines the procedure for hypothesis testing using both the critical value method and the p-value method. It begins with formulating the null and alternative hypotheses, identifying the sample statistic, and graphing the sampling distribution of the sample statistic under the assumption of the null hypothesis. The paragraph explains how to determine if the sample statistic is significantly high or low by calculating the corresponding z-score. It then describes the decision-making process involving comparing the p-value to the significance level (alpha) or comparing the test statistic to the critical value to decide whether to reject the null hypothesis.
📈 Application of Hypothesis Testing in Medical Malpractice Lawsuits
The paragraph presents a real-world example of hypothesis testing applied to a study of medical malpractice lawsuits. It describes how to set up the null and alternative hypotheses based on the claim that most lawsuits are dropped or dismissed. The example involves calculating the sample proportion of dismissed lawsuits and using this to test the claim against the null hypothesis that the true population proportion is 0.5. The paragraph guides through checking the requirements for the normal approximation, computing the sample proportion, and setting up the hypothesis test to evaluate the claim.
📝 Calculation and Interpretation of Test Statistic
This section focuses on the calculation of the test statistic, specifically the z-score, for the hypothesis test about the proportion of medical malpractice lawsuits that are dropped or dismissed. It explains how to convert the sample proportion (p-hat) to a z-score by subtracting the population proportion (p) and dividing by the standard deviation of the sampling distribution of p-hat. The result is a z-score that indicates how many standard deviations p-hat is from the mean, providing a measure of the sample statistic's deviation from the null hypothesis.
📊 Hypothesis Testing Conclusion Using P-Value Method
The paragraph discusses the conclusion of the hypothesis test using the p-value method. It describes how the test statistic's p-value, which is the probability of observing a test statistic as extreme or more extreme than the one calculated, is compared to the significance level (alpha). Given the p-value is much smaller than alpha, the null hypothesis is rejected, indicating strong evidence to support the original claim that the majority of medical malpractice lawsuits are dropped or dismissed. The paragraph emphasizes the interpretation of the results in the context of the hypothesis test.
🔢 Hypothesis Testing Conclusion Using Critical Value Method
This section concludes the hypothesis test using the critical value method. It involves determining the critical z-value that corresponds to the significance level and comparing it to the test statistic's z-score. Since the test statistic's z-score is significantly higher than the critical value, the null hypothesis is rejected, aligning with the conclusion from the p-value method. The paragraph reinforces the idea that both methods lead to the same conclusion, providing evidence to support the claim about the proportion of dismissed medical malpractice lawsuits.
📝 Final Conclusion and Comparison of Testing Methods
The final paragraph wraps up the video by reiterating the conclusion that there is sufficient evidence to support the claim that most medical malpractice lawsuits are dropped or dismissed. It also sets the stage for the next video, which will discuss the confidence interval method and compare it with the p-value and critical value methods. The paragraph emphasizes the importance of understanding different statistical methods for hypothesis testing and their implications in real-world scenarios.
Mindmap
Keywords
💡Normal Approximation Methods
💡P-value
💡Critical Value
💡Confidence Interval
💡Sample Proportion (P-hat)
💡Null Hypothesis
💡Alternative Hypothesis
💡Z-score
💡Binomial Distribution
💡Significance Level (Alpha)
Highlights
Introduction to part one of testing a claim about a proportion using two normal approximation methods.
Explanation of p-value and critical value methods in hypothesis testing.
Discussion on the differences between p-value, critical value methods, and confidence interval methods.
Description of the requirements for using normal approximation methods in statistical analysis.
Review of notation including sample size (n), population proportion (p), and sample proportion (p-hat).
Importance of simple random sampling and its distinction from random sampling.
Conditions for a binomial distribution including fixed number of trials and independence of trials.
Assumption of equal probability of success across all trials for the normal approximation to be valid.
Requirement that n times p and n times q must be greater than or equal to 5 for normal approximation.
Calculation of the test statistic z-score for the sample proportion.
Procedure for hypothesis testing using both the p-value method and the critical value method.
Process of making a decision about the null hypothesis relative to the desired significance level.
Use of p-values as probabilities to determine if the test statistic is significantly high or low.
Critical value method's approach to comparing z-scores to determine statistical significance.
Example of testing a claim about the proportion of medical malpractice lawsuits dropped or dismissed.
Application of normal approximation to the sampling distribution of sample proportions in a real-world example.
Graphical representation of the sampling distribution and the concept of critical region.
Final conclusion about the original claim using both p-value and critical value methods.
Comparison of the p-value and critical value methods in terms of their outcomes and interpretations.
Upcoming discussion on the confidence interval method and its comparison with p-value and critical value methods.
Transcripts
Browse More Related Video
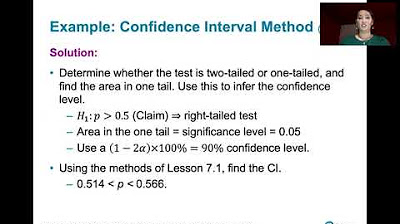
8.2.2 Testing a Claim About A Proportion - Confidence Interval Method, Comparison to Other Methods
9.1.1 Two Proportions - Rationale Behind Hypothesis Tests Involving Two Proportions
9.2.2 Two Means, Independent Samples - The Rationale Behind The Equivalent Methods, P-value Method
9.1.3 Two Proportions - Example, Critical Value Method, Normal Approximation
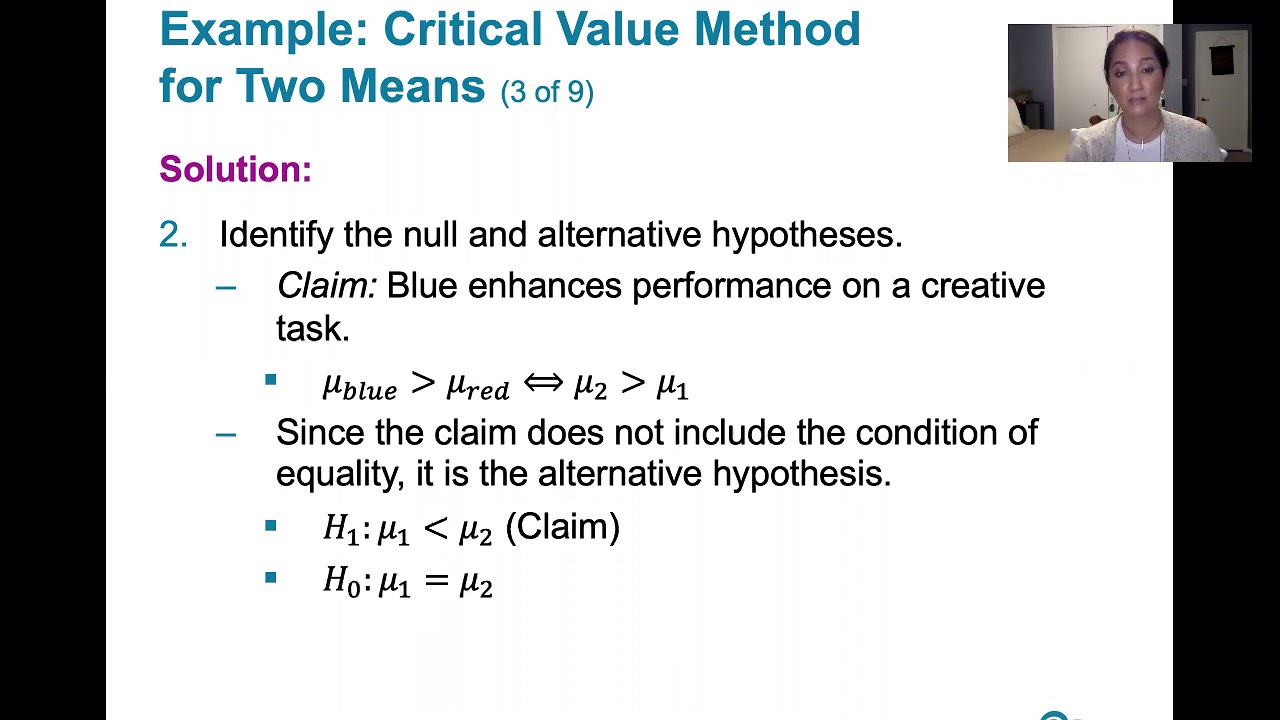
9.2.3 Two Means, Indep. Samples - Critical Value Method, St. Deviations Unknown, Not Assumed Equal
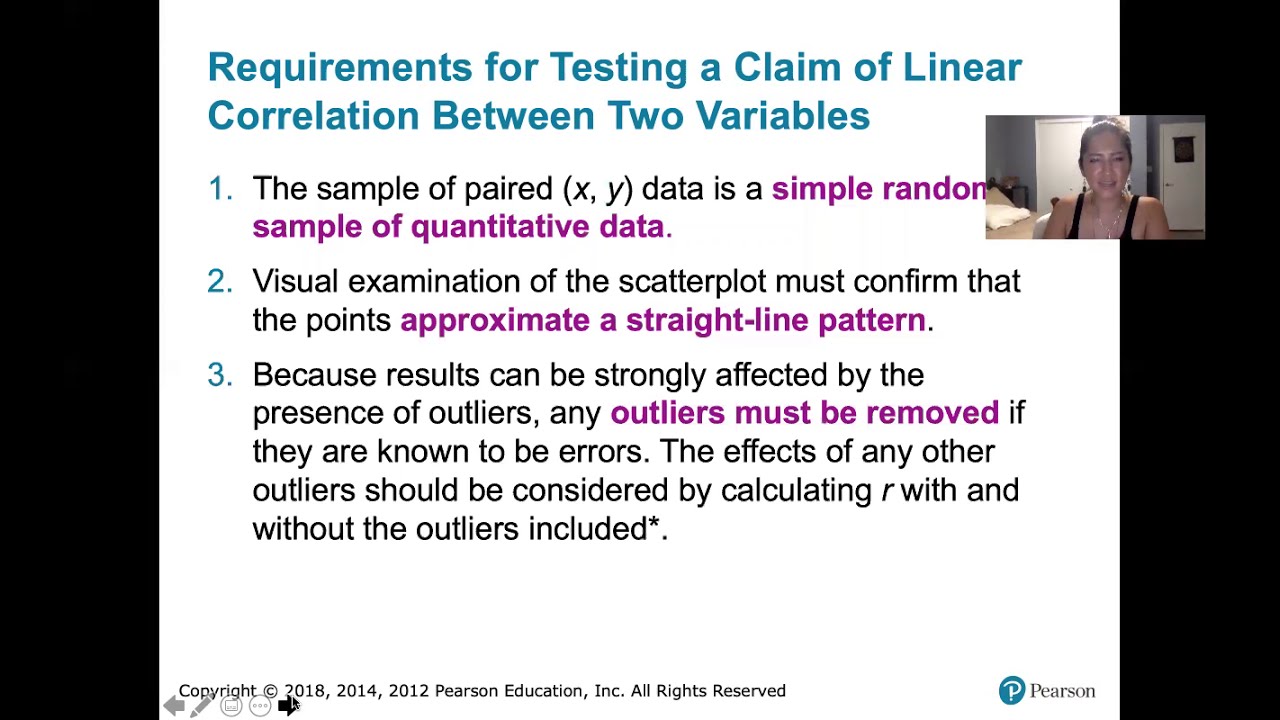
10.1.5 Correlation - Testing a Claim of Correlation Using the P-Value Method
5.0 / 5 (0 votes)
Thanks for rating: