9.2.4 Two Means, Indep. Samples - Confidence Intervals, St. Deviations Unknown, Not Assumed Equal
TLDRThis video tutorial delves into constructing a confidence interval estimate for the difference between two population means, using sample data from independent groups. It assumes unknown and unequal population standard deviations. The lesson outlines the prerequisites for this method, guides through hypothesis formulation, and demonstrates the calculation of the confidence interval. The example of testing the impact of color on creativity illustrates the process, leading to a conclusion about the null hypothesis and the original claim, providing a clear understanding of statistical inference in hypothesis testing.
Takeaways
- 📚 The video discusses constructing a confidence interval estimate for the difference between two means, which is part of learning outcome number four for lesson 9.2.
- 🔍 It covers testing a claim about two means using sample data from two independent samples, assuming the population standard deviations are unknown and not equal.
- 📉 The prerequisites for using this method include having two independent simple random samples and meeting certain conditions related to sample size or population distribution.
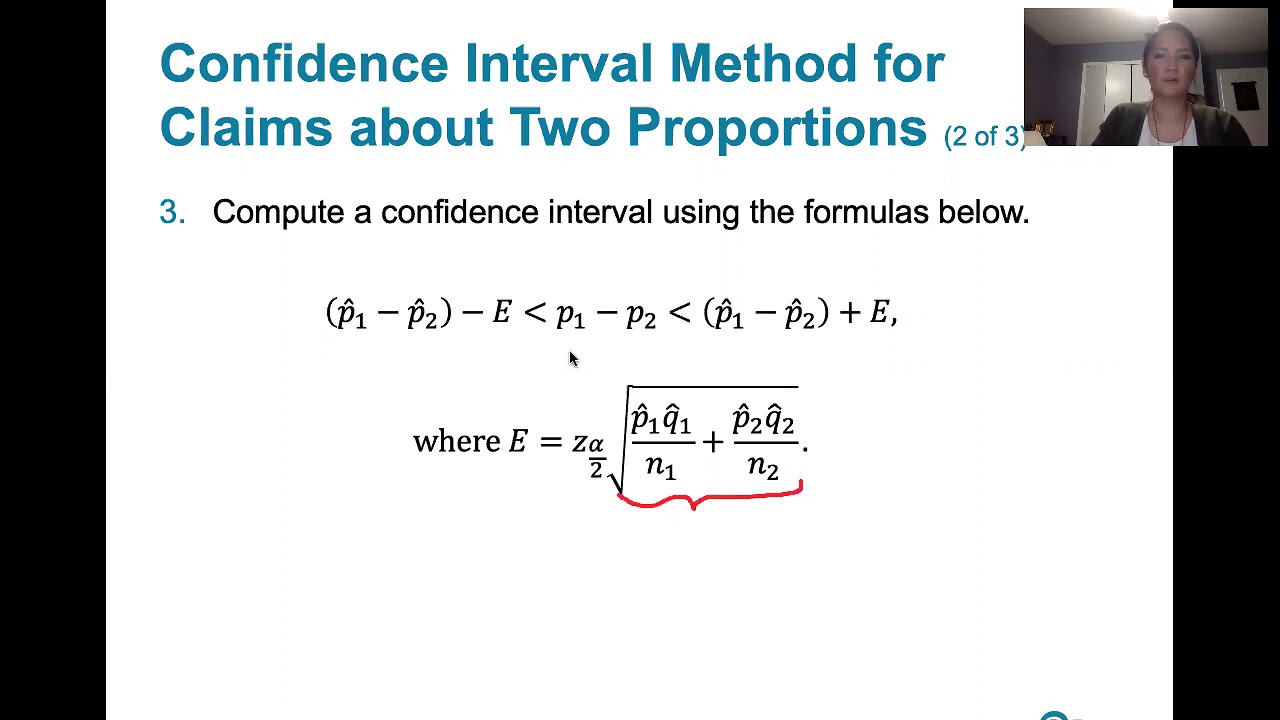
- 📝 The process involves stating the null and alternative hypotheses symbolically, and using specific formulas to compute the confidence interval.
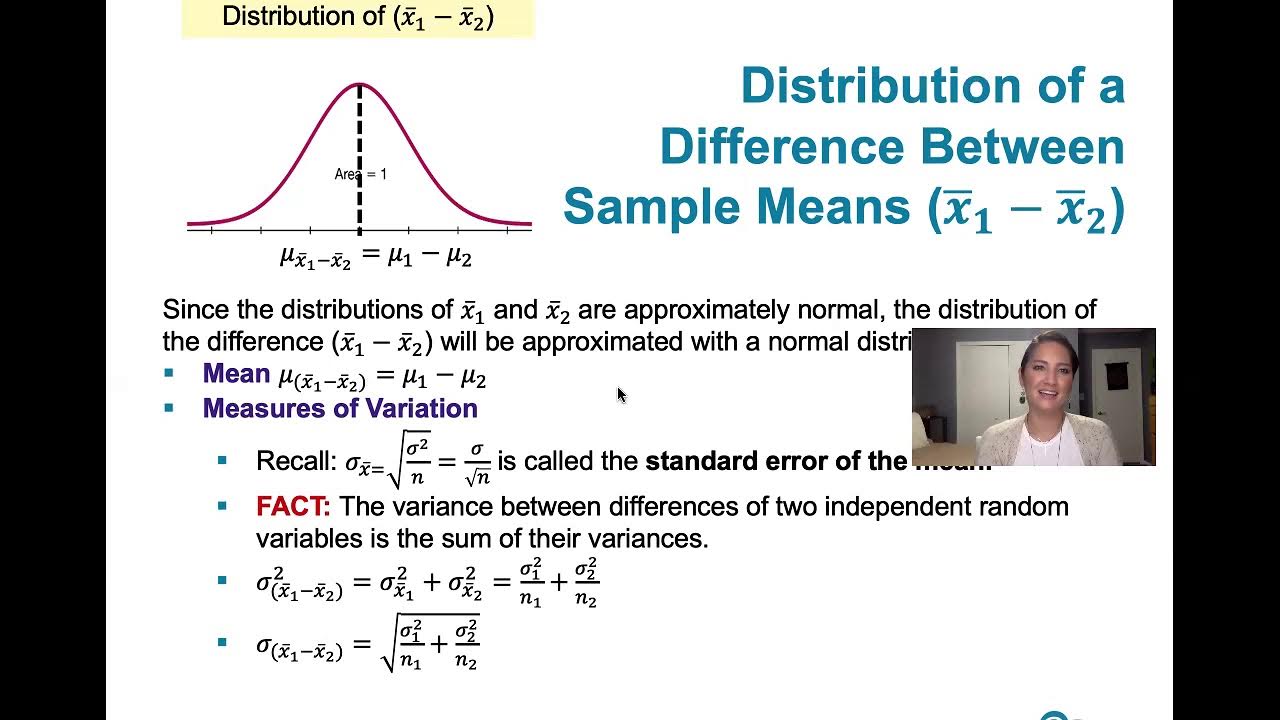
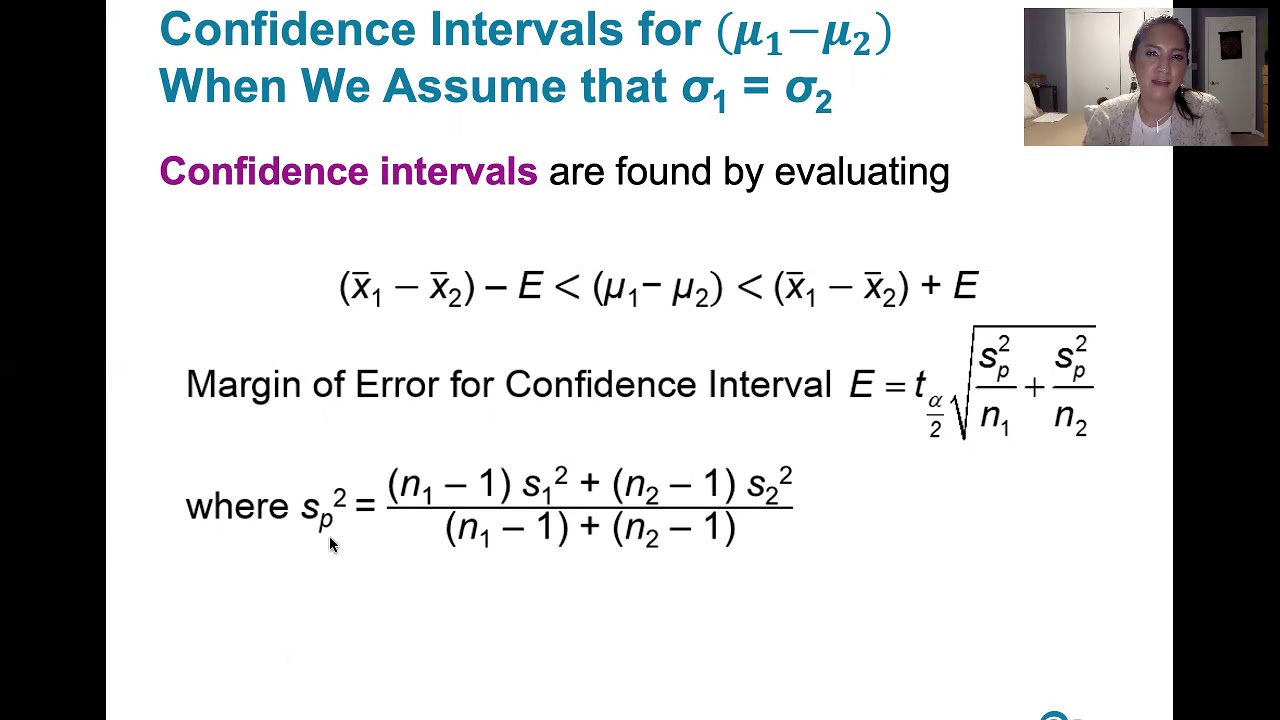
- 🧐 The point estimate for the difference between the two population means (μ1 and μ2) is calculated as the difference between the sample means (x̄1 - x̄2).
- 📊 The margin of error is calculated using a t-score and an estimate of the standard deviation of the sampling distribution of the difference between the sample means.
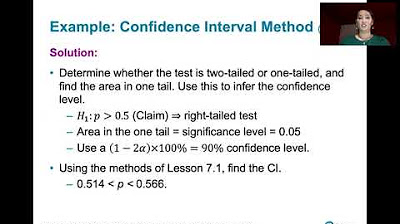
- 📉 The t-score (t-alpha/2) is determined based on the significance level and whether the test is one-tailed or two-tailed, which is derived from the alternative hypothesis.
- 🔑 To make a decision about the null hypothesis, the interval is examined to see if zero is included; if not, the null hypothesis is rejected.
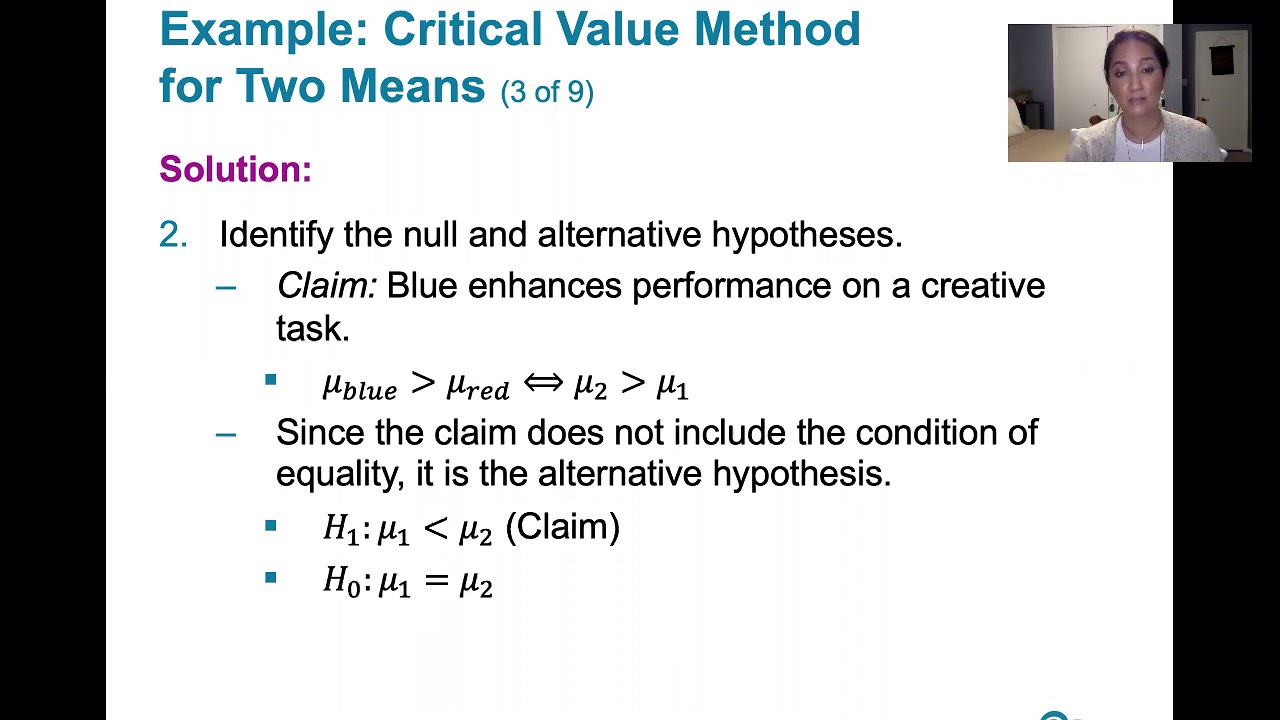
- 🌰 The video provides an example where researchers investigate the effect of color on creativity, using a confidence interval with a 0.01 significance level to test the claim that blue enhances performance on a creative task.
- 📝 Excel is demonstrated as a tool for performing calculations related to the confidence interval, including the use of inverse functions to find the t-score.
- 📉 The final conclusion of the example rejects the null hypothesis, supporting the claim that blue enhances creativity, based on the confidence interval not including zero.
Q & A
What is the main topic of the video?
-The main topic of the video is constructing a confidence interval estimate of the difference between two means and using it to test a hypothesis, particularly when the population standard deviations are unknown and not assumed to be equal.
What are the prerequisites for constructing a confidence interval in this context?
-The prerequisites include having two independent simple random samples and meeting one or both of these conditions: both sample sizes need to be large (greater than 30) or both samples come from populations with normal distributions.
What is the first step in constructing a confidence interval for the difference between two means?
-The first step is to check the requirements, which are the same as for the p-value method and critical value method, including the assumption that the population standard deviations are unknown and not equal.
How is the point estimate for the difference between two population means calculated?
-The point estimate is calculated by finding the difference between the sample means of the two groups, which is denoted as x̄₁ - x̄₂.
What is the formula for the margin of error in the confidence interval for the difference between two means?
-The margin of error is calculated using the formula t(α/2) * sqrt[(s₁²/n₁) + (s₂²/n₂)], where t(α/2) is the t-value corresponding to the desired confidence level and degrees of freedom, and s₁ and s₂ are the sample standard deviations with sample sizes n₁ and n₂ respectively.
How does the decision about the null hypothesis relate to the confidence interval?
-If the difference (mu₁ - mu₂) equals 0 is within the confidence interval, it suggests that the null hypothesis might be true and should not be rejected. If it is not within the interval, the null hypothesis is likely not true and should be rejected.
What is the significance of the t-value in the margin of error calculation?
-The t-value, specifically t(α/2), is used to determine the critical value that separates a certain amount of area in the tails from the middle area of the t-distribution, which is essential for calculating the margin of error in the confidence interval.
How does the video script illustrate the process of constructing a confidence interval?
-The script provides an example from a study on the effects of color on creativity, where researchers tested the claim that blue enhances performance on a creative task using the confidence interval method with a 0.01 significance level.
What is the difference between using an estimated number of degrees of freedom and the exact number?
-Using an estimated number of degrees of freedom (typically the smaller of n₁-1 and n₂-1) can provide a conservative approach, while using the exact number of degrees of freedom (based on the formula involving a and b values) can give a more precise result but may require technology for calculation.
What is the conclusion of the example provided in the script regarding the effect of color on creativity?
-The conclusion is that there is sufficient evidence to support the claim that blue enhances performance on a creative task, as the confidence interval for the difference between the means does not include zero, indicating that the blue group's mean creativity score is likely greater than the red group's.
Outlines
📊 Introduction to Confidence Intervals for Comparing Two Means
This paragraph introduces the concept of constructing a confidence interval estimate for the difference between two means, as part of learning outcome number four for lesson 9.2. It discusses the prerequisites for using this statistical method, which include having two independent samples with unknown but potentially unequal population standard deviations. The paragraph outlines the steps for constructing the confidence interval and emphasizes the importance of checking the method's requirements before proceeding.
🔍 Hypothesis Testing Using Confidence Intervals
The second paragraph delves into the process of using a confidence interval to test a hypothesis about the difference between two means. It explains the conditions under which a confidence interval is appropriate, such as having large sample sizes or samples from normally distributed populations. The paragraph also details the steps for hypothesis testing, including stating the null and alternative hypotheses, computing the confidence interval, and making a decision about the null hypothesis based on whether zero falls within the interval.
📚 Example Application: Color and Creativity
This paragraph presents an example of how to apply the confidence interval method to test a hypothesis, using a study on the effects of color on creativity. It outlines the steps for checking the requirements, stating hypotheses, and computing the confidence interval. The example uses data from subjects who were asked to think of creative uses for a brick, with some in a red background and others in a blue background, to illustrate the process of hypothesis testing.
📉 Calculating the Margin of Error and Confidence Interval
The fourth paragraph focuses on the calculation of the margin of error for the confidence interval, which is essential for determining the interval itself. It explains how to estimate the standard deviation of the sampling distribution of the difference between the two sample means and how to find the appropriate t-value for the given confidence level. The paragraph also discusses the use of technology, such as Excel, for these calculations and the importance of choosing the correct degrees of freedom.
📝 Constructing the Confidence Interval and Making a Decision
This paragraph describes the process of constructing the actual confidence interval using the calculated margin of error and the difference between the sample means. It explains how to determine the upper and lower limits of the interval and how to interpret these limits in the context of the null hypothesis. The paragraph also discusses the implications of using either an estimated or exact number of degrees of freedom on the size of the confidence interval.
🚩 Conclusion and Supporting the Original Claim
The final paragraph concludes the video script by summarizing the findings from the confidence interval analysis and making a decision about the null hypothesis. It explains that if zero is not included in the confidence interval, the null hypothesis is rejected, supporting the original claim that one population mean is greater than the other. The paragraph also emphasizes the importance of stating the conclusion in non-technical terms to make the findings accessible to a broader audience.
🔄 Alternate Methods for Testing Claims About Two Population Means
The last paragraph briefly mentions that there are alternate methods for testing claims about two population means when the conditions for using the confidence interval method are not met. It suggests that these alternate methods will be discussed in a future video, indicating a continuation of the topic beyond the current script.
Mindmap
Keywords
💡Confidence Interval
💡Population Standard Deviations
💡Independent Samples
💡Normal Distributions
💡Null Hypothesis
💡Alternative Hypothesis
💡Point Estimate
💡Margin of Error
💡t-distribution
💡Hypothesis Testing
💡Sample Variances
💡Degrees of Freedom
Highlights
The video discusses constructing a confidence interval estimate for the difference between two means, a method used to test claims about two means with sample data from independent samples.
Assumptions include unknown population standard deviations and no reason to assume they are equal.
The outline for constructing a confidence interval includes checking requirements, stating hypotheses, computing the interval, and making a decision about the null hypothesis.
Requirements for this method are two independent simple random samples and either large sample sizes or samples from normally distributed populations.
The point estimate for the difference between two population means is calculated as the difference between the sample means.
The margin of error in the confidence interval is calculated using a t-value and an estimate of the standard deviation of the sampling distribution.
The t-value selection depends on the significance level and whether the test is one-tailed or two-tailed.
The decision about the null hypothesis is made by checking if zero is within the confidence interval; if not, the null hypothesis is rejected.
An example from the University of British Columbia investigates the effect of color on creativity, comparing red and blue backgrounds.
The researchers claim that blue enhances performance on a creative task, which is tested using a 0.01 significance level.
The sample data includes creativity scores for subjects with red and blue backgrounds, with sample sizes of 35 and 36, respectively.
The sample standard deviations and means are used to compute the estimated standard deviation for the sampling distribution of the difference between means.
Excel can be used to calculate the point estimate, estimated standard deviation, and margin of error for the confidence interval.
The choice between using a conservative estimate or the exact number of degrees of freedom affects the size of the confidence interval.
The final conclusion supports the original claim that blue enhances performance on a creative task, based on the confidence interval not including zero.
The video concludes with a discussion of alternate methods for testing claims about two population means when conditions are not met for the current method.
Transcripts
Browse More Related Video
9.2.2 Two Means, Independent Samples - The Rationale Behind The Equivalent Methods, P-value Method
9.2.3 Two Means, Indep. Samples - Critical Value Method, St. Deviations Unknown, Not Assumed Equal
9.1.4 Two Proportions - Confidence Intervals for the Difference Between Two Proportions
8.2.2 Testing a Claim About A Proportion - Confidence Interval Method, Comparison to Other Methods

Elementary Stats Lesson #22
9.2.5 Two Means, Indep. Samples - Three Additional Cases for Hypothesis Tests, Confidence Intervals
5.0 / 5 (0 votes)
Thanks for rating: