8.2.2 Testing a Claim About A Proportion - Confidence Interval Method, Comparison to Other Methods
TLDRThis educational video script delves into testing claims about proportions using normal approximation methods. It focuses on the confidence interval method, contrasting it with p-value and critical value methods. The script explains the prerequisites for using these methods, including simple random sampling and binomial distribution requirements. It guides viewers through constructing a confidence interval and using it to make decisions about the null hypothesis. An example illustrates the process, emphasizing the potential for different conclusions from the confidence interval method due to its unique standard deviation assumptions. The video concludes with a recommendation to use confidence intervals for estimation and p-value and critical value methods for hypothesis testing.
Takeaways
- 📚 The video continues the study of testing claims about a proportion using normal approximation methods, focusing on the confidence interval method compared to the p-value and critical value methods.
- 🔍 The confidence interval method is introduced as the third and final normal approximation method for testing claims about a proportion.
- 📉 The video aims to teach viewers how to test a claim about a proportion using the confidence interval method and to explain why this method may not lead to the same conclusion as the other two methods.
- 🎯 The prerequisites for using the confidence interval method include having a simple random sample and meeting the requirements for a binomial distribution.
- 🔄 The binomial distribution requirements include a fixed number of trials, two outcomes per trial, independence of trials, and a constant probability of success across trials.
- ⚖️ For a normal approximation to be used, there must be at least five expected successes and five expected failures under the assumption that the null hypothesis is true.
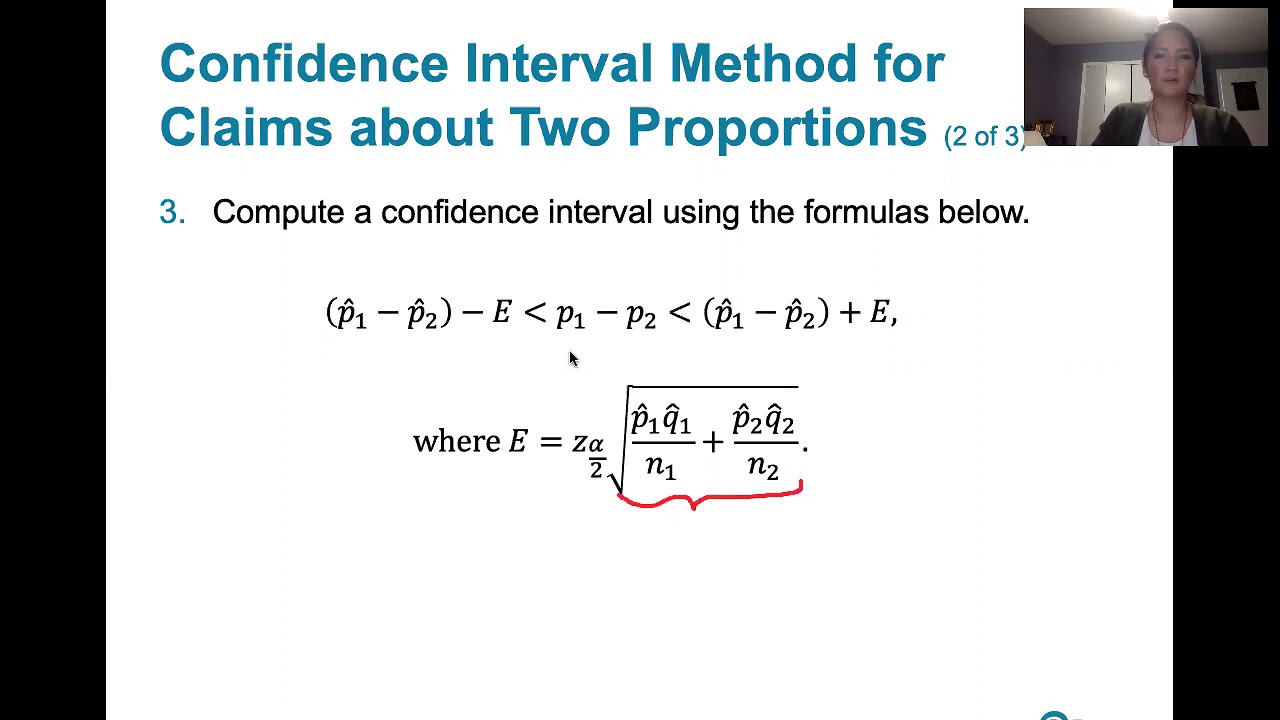
- 📝 The process of constructing a confidence interval involves calculating a sample proportion and adding/subtracting the margin of error, which is determined by a z-score.
- 📊 The z-score used in the confidence interval method is based on the sample proportion, unlike the p-value and critical value methods which use the proportion from the null hypothesis.
- The decision to reject or fail to reject the null hypothesis using the confidence interval method depends on whether the assumed population proportion lies within the interval.
- 🚫 The video emphasizes that the confidence interval method is not equivalent to the p-value and critical value methods, as they can sometimes lead to different conclusions.
- 📈 The video recommends using confidence intervals for estimating population proportions due to their basis on assumptions about the sample proportion rather than the population proportion itself.
Q & A
What are the three normal approximation methods discussed in the video?
-The three normal approximation methods discussed are the p-value method, the critical value method, and the confidence interval method.
Why is the distinction between a simple random sample and a random sample important for the confidence interval method?
-The distinction is important because the confidence interval method requires a simple random sample to ensure that the sample data is representative and unbiased, which is a key assumption for the method to be valid.
What are the requirements for using a normal approximation to the sampling distribution in the context of the confidence interval method?
-The requirements include having a simple random sample, meeting the conditions for a binomial distribution (fixed number of trials, two outcomes per trial, trials are independent, and the probability of success is the same in each trial), and having at least five expected successes and failures under the assumption that the null hypothesis is true.
How is the sample proportion (p-hat) calculated in the context of the confidence interval method?
-The sample proportion (p-hat) is calculated as the number of successes divided by the total number of trials in the sample.
What does the error term in the confidence interval formula represent?
-The error term, represented by z sub alpha over 2 times the standard deviation approximation, represents the margin of error around the sample proportion (p-hat) within which the true population proportion (p) is estimated to lie with a certain level of confidence.
Why might the confidence interval method not lead to the same conclusion as the p-value and critical value methods?
-The confidence interval method might not lead to the same conclusion because it uses a different standard deviation in its calculations, based on the sample proportion (p-hat), rather than the population proportion (p) assumed in the null hypothesis as in the p-value and critical value methods.
What is the null hypothesis in the example provided about consumer comfort with drone deliveries?
-The null hypothesis is that the proportion of consumers who are comfortable with drone deliveries (p) is equal to 0.5.
How is the confidence level determined when constructing a confidence interval for testing a claim?
-The confidence level is determined based on the significance level (alpha) of the test. If the original test was one-tailed, the alpha is doubled and subtracted from one to find the confidence level. For a two-tailed test, one minus alpha gives the confidence level.
What does it mean to fail to reject the null hypothesis when interpreting a confidence interval?
-Failing to reject the null hypothesis means that the confidence interval includes the value stated in the null hypothesis, suggesting that the null hypothesis might be true and there is not enough evidence to support the alternative hypothesis.
How should the final conclusion of a hypothesis test be stated using the confidence interval method?
-The final conclusion should be stated in terms of the original claim, in a way that is understandable to everyone without requiring knowledge of statistical terms like null hypothesis, confidence interval, p-value, etc.
Why are the p-value and critical value methods considered equivalent when testing claims about proportions?
-The p-value and critical value methods are considered equivalent because they both use the same test statistic and the same standard deviation based on the assumed population proportion from the null hypothesis, leading to the same conclusion in hypothesis testing.
Outlines
📚 Introduction to Testing Proportions with Confidence Intervals
This paragraph introduces the topic of the video, which is the continuation of studying methods for testing claims about proportions using normal approximation. It focuses on the confidence interval method, contrasting it with the previously discussed p-value and critical value methods. The speaker aims to teach viewers how to use the confidence interval method to test claims about a proportion and to understand why it might lead to different conclusions than the other two methods. The paragraph outlines the prerequisites for using a normal approximation, emphasizing the importance of a simple random sample and the conditions for a binomial distribution, including a fixed number of trials, two outcomes per trial, trial independence, and equal probability of success across trials.
🔍 Detailed Requirements for Using Normal Approximation
The second paragraph delves deeper into the specific requirements for using a normal approximation to the sampling distribution. It explains the necessity for at least five expected successes and failures under the assumption that the null hypothesis is true. The null hypothesis is defined as the statement that the population proportion is equal to a certain value. The paragraph also discusses the computation of the sample proportion (p-hat) and the error associated with it, which is based on the z-score corresponding to the desired confidence level. The speaker clarifies the difference between a simple random sample and a random sample, advising future scientists to distinguish between the two, although for the class's purposes, the distinction is not overly emphasized.
📉 Constructing and Interpreting Confidence Intervals
This paragraph explains the process of constructing a confidence interval for a population proportion. It details the steps to calculate the interval using the sample proportion, the z-score for the desired confidence level, and the standard error of the sample proportion. The speaker discusses how to interpret the confidence interval in the context of the null hypothesis, explaining that if the assumed value of the population proportion lies within the interval, the null hypothesis is not rejected, but if it lies outside, the null hypothesis is rejected. The paragraph also emphasizes the importance of stating the conclusion in terms of the original claim, using an example of consumer comfort with drone deliveries.
📊 Hypothesis Testing with Confidence Intervals
The fourth paragraph continues the discussion on hypothesis testing, specifically focusing on how to apply a confidence interval to test a claim. It outlines the process of setting up null and alternative hypotheses, determining whether the test is one-tailed or two-tailed, and finding the area in one tail to infer the confidence level. The speaker uses the example of testing the claim that the majority of consumers are uncomfortable with drone deliveries, demonstrating how to calculate the confidence interval and interpret the results to make a decision about the null hypothesis.
🤔 Comparing Methods for Testing Proportions
In this paragraph, the speaker discusses the differences between the confidence interval method and the p-value and critical value methods for testing claims about proportions. It highlights that while the p-value and critical value methods are equivalent and always yield the same results, the confidence interval method may sometimes lead to different conclusions. The speaker emphasizes the importance of understanding the assumptions behind each method and when they might lead to different outcomes.
🛠️ Technical Difficulties and Method Recommendations
The final paragraph of the script is marked by technical difficulties experienced by the speaker, which occasionally interrupts the flow of information. Despite these issues, the speaker manages to convey the recommendation that confidence intervals should be used for estimating population proportions due to their basis on sample proportions rather than assumptions about the population proportion itself. The paragraph concludes with advice on using confidence intervals for estimation and p-value and critical value methods for testing claims, providing clarity on the appropriate application of each method.
Mindmap
Keywords
💡Normal Approximation
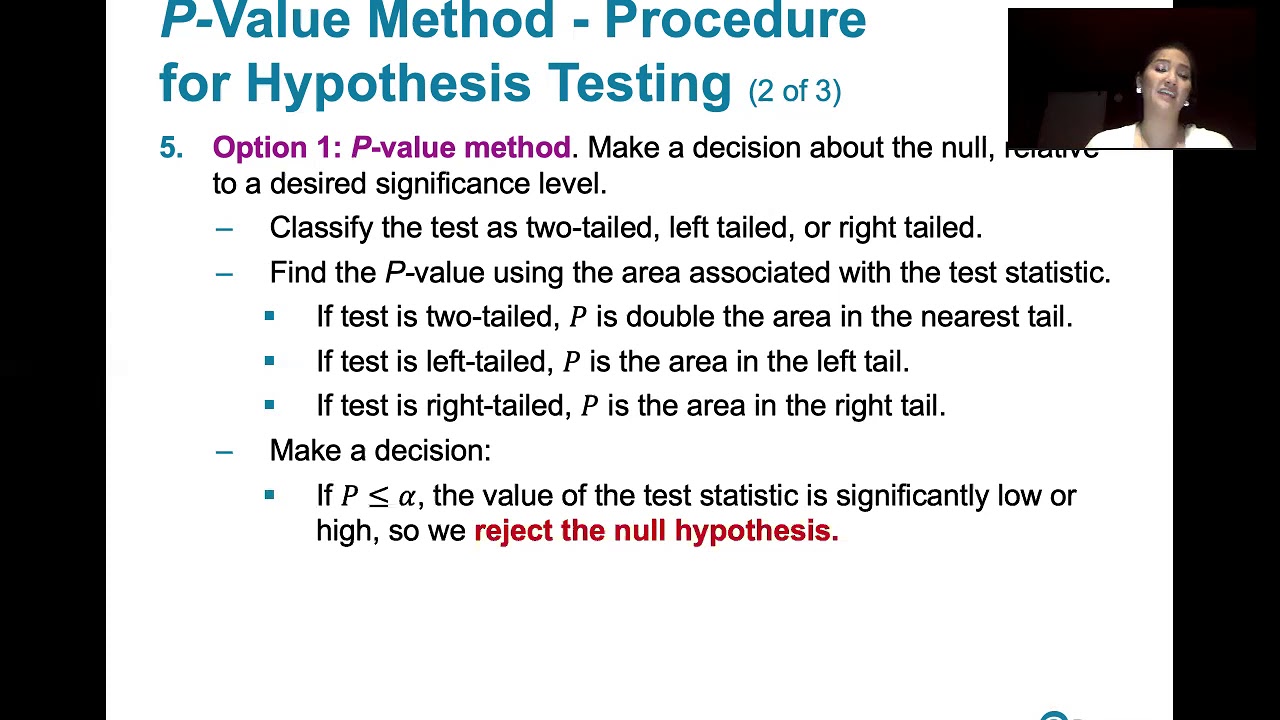
💡P-value Method
💡Critical Value Method
💡Confidence Interval Method
💡Binomial Distribution
💡Simple Random Sample
💡Hypothesis Testing
💡Null Hypothesis
💡Alternative Hypothesis
💡Significance Level
💡Sample Proportion
Highlights
Introduction to the third normal approximation method for testing claims about a proportion using the confidence interval method.
Explanation of the difference between the confidence interval method and the p-value and critical value methods.
Requirement for using a normal approximation to the sampling distribution, including the sample data forming a simple random sample.
Distinguishing between a simple random sample and a random sample for scientific and social science applications.
Assumption of simple random sample if 'randomly selected' is mentioned in the problem statement.
Requirements for a binomial distribution: fixed number of trials, two outcomes per trial, trials independence, and equal probability of success.
Condition for expected successes and failures in the context of the null hypothesis for using a normal approximation.
Process of computing a confidence interval for estimating a population proportion.
Use of z-scores in determining the error margin in the confidence interval calculation.
Interpretation of the confidence interval in relation to the null hypothesis and making a decision about it.
Example problem involving testing a claim about consumer comfort with drone deliveries using a confidence interval.
Construction of a confidence interval at a specific confidence level and its interpretation.
Difference in the standard deviation used in the confidence interval method versus the p-value and critical value methods.
Potential for different conclusions from the confidence interval method compared to the p-value and critical value methods.
Recommendation to use confidence intervals for estimating population proportions due to their basis on sample proportion rather than assumed population proportion.
Clarification that the p-value and critical value methods are equivalent and will always yield the same results, unlike the confidence interval method.
Discussion on the non-equivalence of the confidence interval method with the p-value and critical value methods when testing claims about proportions.
Transcripts
Browse More Related Video
9.1.4 Two Proportions - Confidence Intervals for the Difference Between Two Proportions
9.2.2 Two Means, Independent Samples - The Rationale Behind The Equivalent Methods, P-value Method
9.1.0 Two Proportions - Lesson Overview, Key Concepts, Learning Outcomes
8.3.1 Testing a Claim About a Mean - With Sigma Not Known, Three Equivalent Methods
8.2.1 Testing a Claim About a Proportion - P-value, Critical Value Methods, Normal Approximation
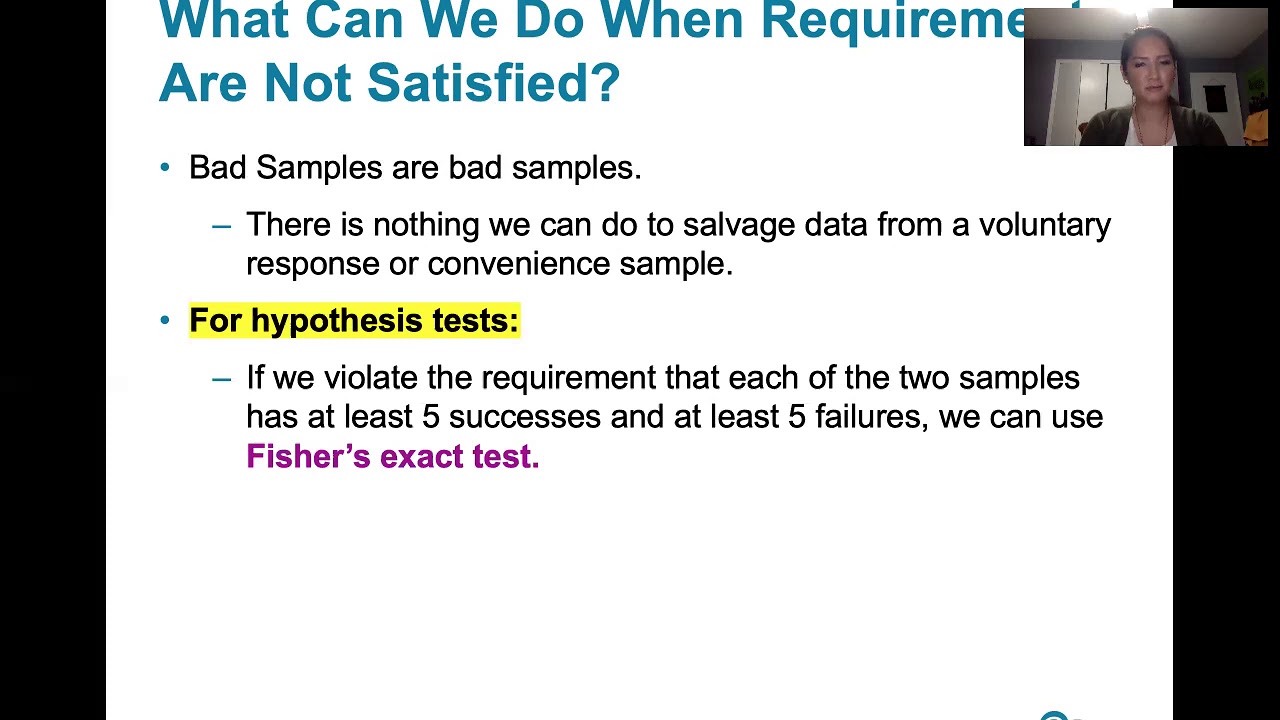
9.1.5 Two Proportions - Hypothesis Testing and Confidence Intervals When Requirements Are Not Met
5.0 / 5 (0 votes)
Thanks for rating: