GCSE Maths - Distance Time Graphs - Basic Introduction for Foundation GCSE (Some Higher)
TLDRThis educational video offers a fundamental introduction to distance-time graphs, illustrating how to plot and interpret them. The presenter explains the setup of axes, with distance on the y-axis and time on the x-axis, and demonstrates the process of graphing a journey with various activities and speeds. The video clarifies the concept of speed as the gradient of the graphed line, showing how to calculate it for different segments of the journey. It also addresses common errors and introduces the idea of velocity, which includes direction. The script is designed to help viewers understand the basics of motion analysis using graphs, with practical examples and step-by-step explanations.
Takeaways
- 📊 Distance-Time Graphs: The script introduces the concept of distance-time graphs, which are used to represent the movement of an object over time.
- 📈 Axes Explanation: The vertical axis (y-axis) represents distance from a fixed point, while the horizontal axis (x-axis) represents elapsed time.
- 🏠 Fixed Point Concept: The fixed point, such as 'home', is the reference from which distances are measured.
- 🚶 Journey Representation: The script uses the example of a person's journey from home to shops, school, and back to illustrate how distance-time graphs can represent real-life scenarios.
- ⏱ Time Measurement: Time is measured in hours, and the graph is segmented to represent different parts of the journey with varying speeds.
- 🔍 Speed Calculation: Speed is calculated as the gradient of the line on the graph, which is the distance traveled divided by the time taken.
- 🛑 Stationary Points: Horizontal lines on the graph indicate periods of time when the object is stationary, meaning no distance is covered.
- 📐 Gradient Significance: The steeper the gradient of a line, the faster the speed, and vice versa.
- 🔢 Average Speed: The average speed for the entire journey can be found by dividing the total distance traveled by the total time taken.
- 📚 Common Errors: The script highlights common mistakes, such as misinterpreting the distance traveled during stationary periods or calculating speed incorrectly.
- 📉 Downhill Travel: Even when traveling downhill, the concept of speed and its calculation via the gradient remains consistent.
- 📌 Graph Construction: The script explains how to construct lines on a graph to represent different speeds and how to interpret these lines.
- 🔍 Detailed Analysis: The script provides a detailed analysis of different sections of a distance-time graph, explaining how to derive speed and understand motion from the graph.
- 📋 Stationary Time Calculation: It explains how to determine the length of time an object is stationary by looking for horizontal sections on the graph.
- 📏 Total Distance and Time: The script demonstrates how to calculate the total distance traveled and the total time taken from the graph.
- 🔄 Return to Origin: When the journey returns to the starting point, the total displacement is zero, which affects the calculation of average velocity.
Q & A
What is the purpose of a distance-time graph?
-A distance-time graph is used to represent the movement of an object over time. It shows the distance traveled by the object from a fixed point against the time elapsed, allowing us to visualize the speed and direction of the object's movement.
What does the vertical axis (y-axis) represent in a distance-time graph?
-The vertical axis (y-axis) in a distance-time graph represents the distance from a fixed point, which could be measured in meters, kilometers, or any other unit of length.
What does the horizontal axis (x-axis) represent in a distance-time graph?
-The horizontal axis (x-axis) in a distance-time graph represents the time elapsed, which is typically measured in hours, minutes, or seconds.
How can you determine the speed from a distance-time graph?
-The speed can be determined from a distance-time graph by looking at the gradient (slope) of a line on the graph. The gradient is calculated as the change in distance (y-axis) divided by the change in time (x-axis).
What does a horizontal line on a distance-time graph indicate?
-A horizontal line on a distance-time graph indicates that the object is stationary, meaning it is not moving from its current position.
How can you calculate the average speed for a journey depicted on a distance-time graph?
-To calculate the average speed for a journey, you sum the total distance traveled and divide it by the total time taken. This can be done by adding up the distances covered in each segment of the journey and dividing by the total hours.
What is the difference between speed and velocity?
-Speed is a scalar quantity that represents the magnitude of how fast an object is moving, without regard to its direction. Velocity, on the other hand, is a vector quantity that includes both the speed and direction of the object's movement.
How can you find the length of time an object was stationary from a distance-time graph?
-To find the length of time an object was stationary, look for horizontal flat lines on the distance-time graph. The duration of the horizontal line represents the time the object was not moving.
What does a steeper slope on a distance-time graph indicate?
-A steeper slope on a distance-time graph indicates a higher speed. The steeper the line, the greater the gradient, and thus the faster the object is moving.
Can you provide an example of how to calculate the speed for a specific time on a distance-time graph?
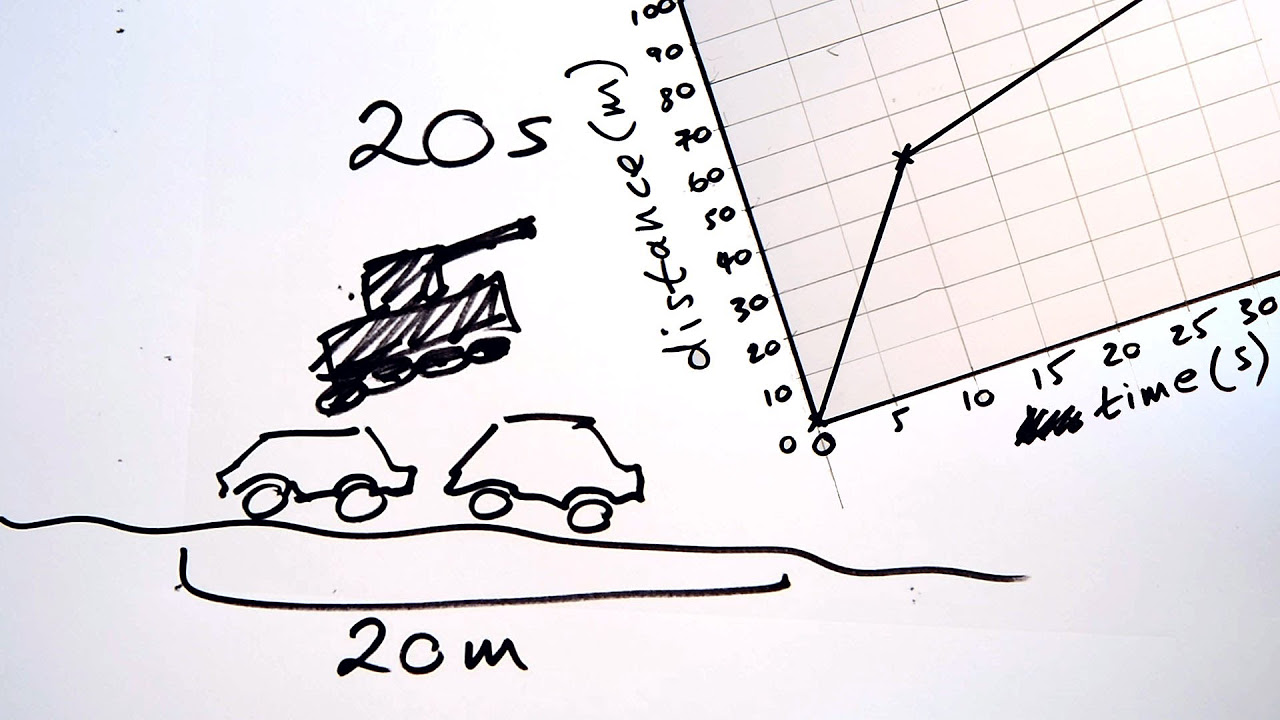
-Certainly. If you have a line on a distance-time graph that shows a distance of 40 meters after 5 seconds, the speed can be calculated as 40 meters divided by 5 seconds, which equals 8 meters per second.
How is average velocity calculated for a journey that returns to the starting point?
-Average velocity is calculated as the total displacement (change in position from start to end) divided by the total time. For a journey that returns to the starting point, the displacement is zero, so the average velocity is also zero, regardless of the path taken or the speed of travel.
Outlines
📊 Introduction to Distance-Time Graphs
This paragraph introduces the concept of distance-time graphs, explaining how to set up a graph with a vertical axis representing distance from a fixed point and a horizontal axis representing elapsed time. The example given illustrates a journey from home to the shops, then to school, and back home, with different segments of the journey represented by straight lines and horizontal lines indicating constant speed and stationary periods, respectively. The gradient of the lines is identified as the speed, and the importance of starting at the origin (0,0) is emphasized for accurate calculations.
🔍 Analyzing Speed and Distance from Graphs
The second paragraph delves into the analysis of speed and distance using the distance-time graph from the first paragraph. It explains how to calculate speed as the gradient of a line on the graph and provides examples of how to determine the speed for different segments of the journey. The paragraph also discusses how to calculate the total distance traveled and the average speed for the entire journey, using the formula speed = distance/time. Common mistakes, such as misinterpreting the total distance covered, are highlighted, and the importance of selecting the correct units (e.g., km/h or m/s) is stressed.
📈 Drawing Speed Lines on a Graph
This paragraph instructs on how to draw speed lines on a graph to represent different speeds. The process begins with starting at the origin (0,0) and drawing straight lines for each speed: 10 km/h, 40 km/h, and 5 km/h. Each speed line is explained in terms of the distance covered over time, with the steepness of the line indicating the speed's magnitude. The paragraph also covers how to adjust the position of the lines to represent the same speed, emphasizing that as long as the lines are parallel, they indicate the same speed regardless of their position on the graph.
⏱ Calculating Time, Speed, and Distance from Graphs
The fourth paragraph continues the exploration of distance-time graphs by calculating the length of time spent stationary, the speed when moving, and the total distance traveled. It uses three different graphs to demonstrate these calculations, showing how to identify stationary periods as horizontal lines and how to determine speeds by selecting points on the graph. The total distance and time are used to calculate the average speed for each journey, with the formula speed = total distance / total time. The importance of showing full workings in an exam setting is also mentioned.
🚀 Advanced Graph Analysis Including Velocity
The final paragraph introduces a more challenging question set that involves analyzing distance-time graphs for a particle's movement from a fixed point over time. The focus is on calculating the total distance traveled, average speed, and velocity at specific times. The paragraph explains the difference between speed and velocity, noting that velocity includes direction. It provides examples of how to calculate the average velocity for different time segments and the overall journey, emphasizing that displacement, rather than total distance, is used for velocity calculations. The average velocity for the entire journey is determined to be zero since the particle ends up at the starting point.
Mindmap
Keywords
💡Distance-Time Graph
💡Gradient
💡Stationary
💡Constant Speed
💡Elapsed Time
💡Average Speed
💡Kilometers per Hour (km/h)
💡Horizontal Axis (x-axis)
💡Vertical Axis (y-axis)
💡Journey
Highlights
Introduction to distance-time graphs and their basic concepts.
Explanation of the vertical (y-axis) representing distance from a fixed point.
Description of the horizontal (x-axis) representing elapsed time.
Illustration of graphing a journey with varying speeds and stops.
Use of a straight line to represent constant speed during a part of the journey.
Introduction of a horizontal line indicating a stationary or stopped state.
Calculation of speed as the gradient of the line on the graph.
Demonstration of how to calculate average speed for different sections of the journey.
Mistake clarification regarding the calculation of speed and distance traveled.
Example of calculating the speed for various parts of the journey using the graph.
Explanation of how to find the total distance traveled and total time taken.
Introduction of the concept that the gradient of a line represents speed.
Instruction on how to graph different constant speeds on a distance-time graph.
Guidance on answering questions related to distance-time graphs and calculating speeds.
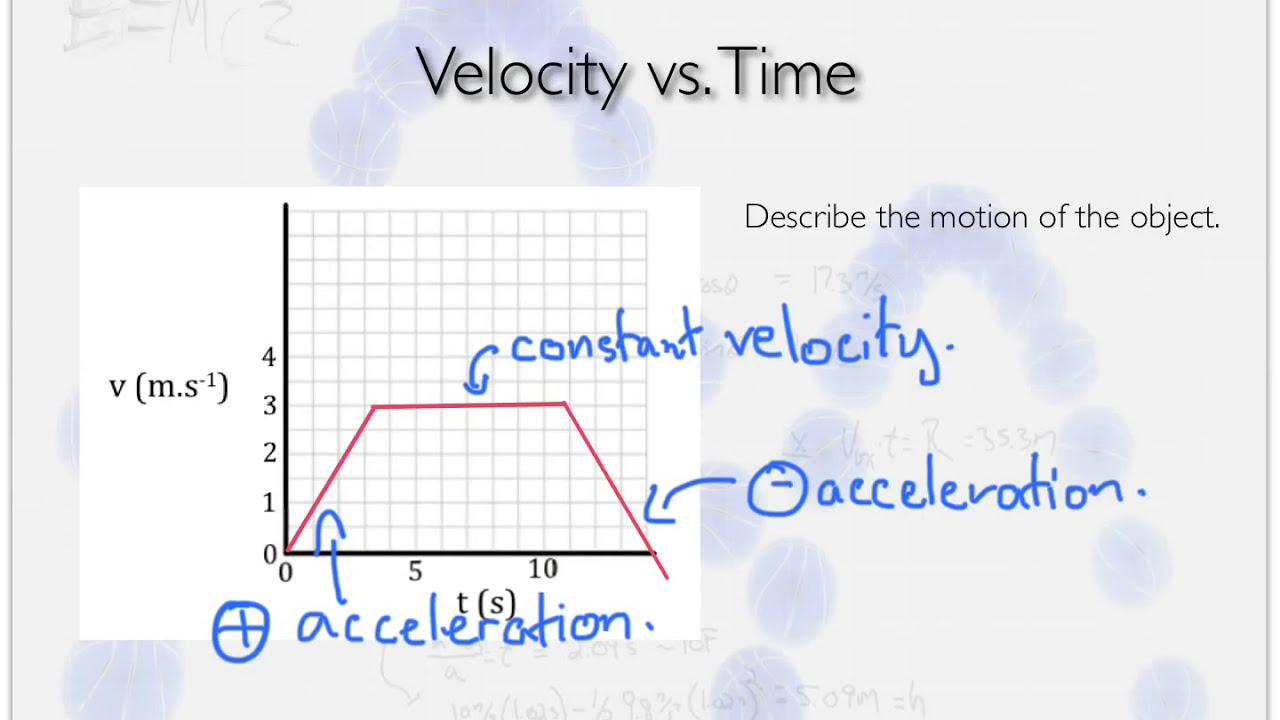
Differentiation between speed and velocity, emphasizing velocity includes direction.
Calculation of average velocity considering the displacement from the starting point.
Conclusion summarizing the importance of understanding distance-time graphs for various speeds and conditions.
Transcripts
Browse More Related Video
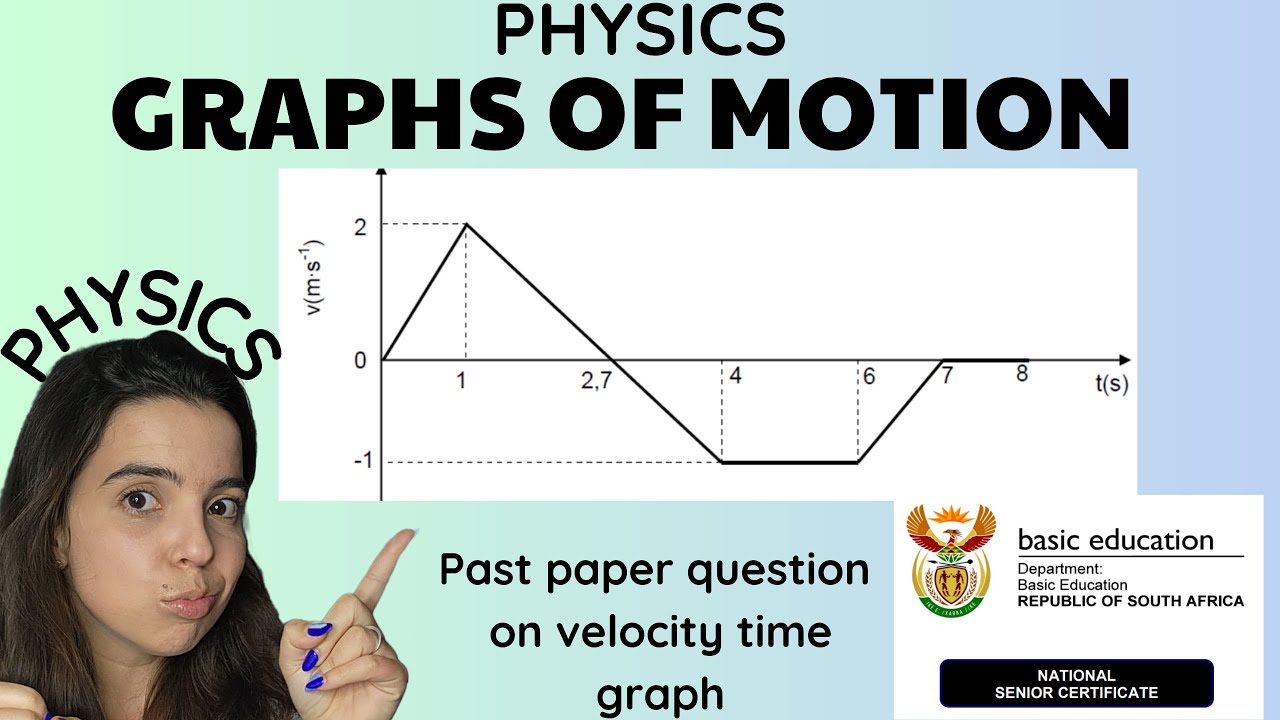
Graphs of Motion Velocity vs Time Graph past paper question
Speed, Velocity and Distance Time Graphs - Physics - Science - Get That C In your GCSE and IGCSE
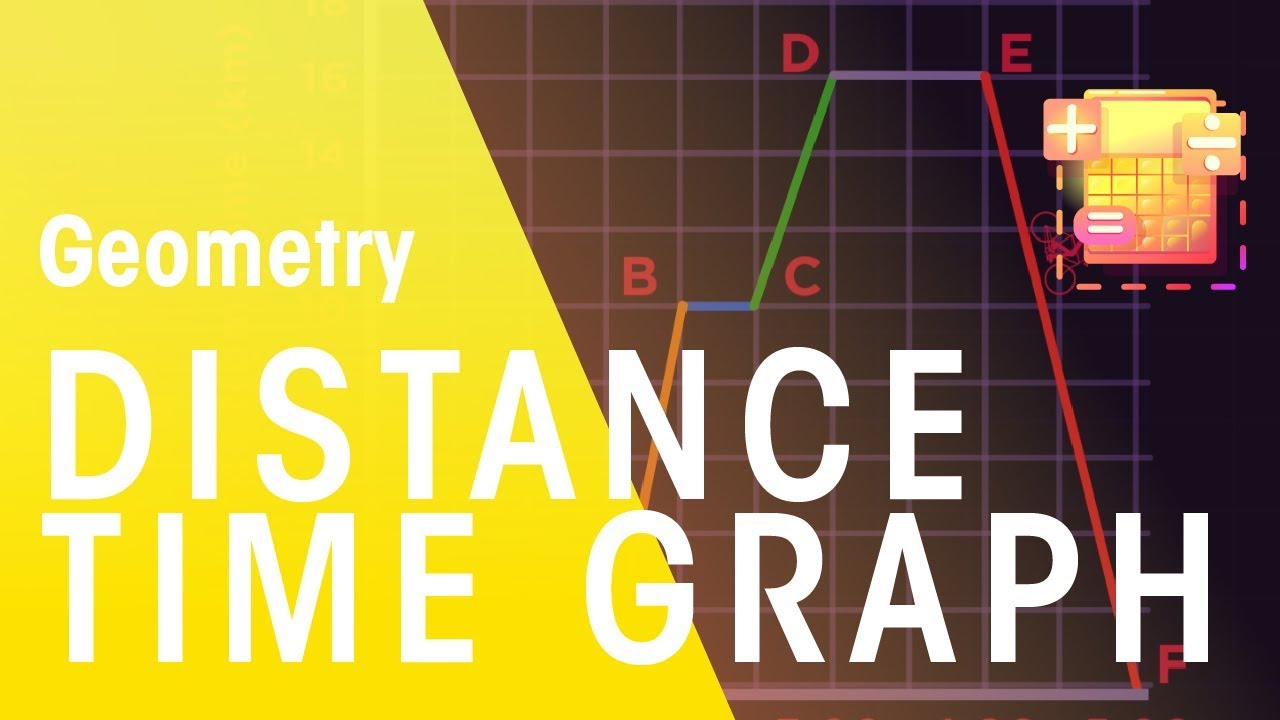
Distance Time Graphs | Geometry | Maths | FuseSchool
Distance-time graphs & speed - GCSE Science Shorts Sketch
GCSE Physics - Distance-Time Graphs #53
Graphs of Motion : Easy and Quick Summary
5.0 / 5 (0 votes)
Thanks for rating: