Displacement Time Graph Grade 10 Science
TLDRThe video script is an educational lesson on displacement and time graphs. It uses various scenarios, such as a person walking and Greg sprinting, to illustrate concepts like total distance traveled, average speed, and velocity at different time intervals. The script explains how to interpret positive and negative values on a number line in relation to displacement, and how to calculate the average velocity by dividing the change in displacement by the change in time. It also clarifies that velocity can be zero when there is no change in displacement. The lesson is interactive, encouraging learners to pause and ensure understanding before proceeding. The scenarios are designed to help learners visualize the movements and apply the mathematical formulas to find answers to questions about the person's or Greg's position, distance, and speed at different points in time.
Takeaways
- 🏠 The concept of displacement is introduced by starting at a person's house as the zero position.
- ➡️ Positive and negative values on the number line represent direction, with right being positive in the first example.
- 🔄 The person's movement is depicted as a series of straight lines on a graph, indicating changes in displacement.
- 🚶♂️ The total distance walked is the sum of all individual movements, regardless of direction.
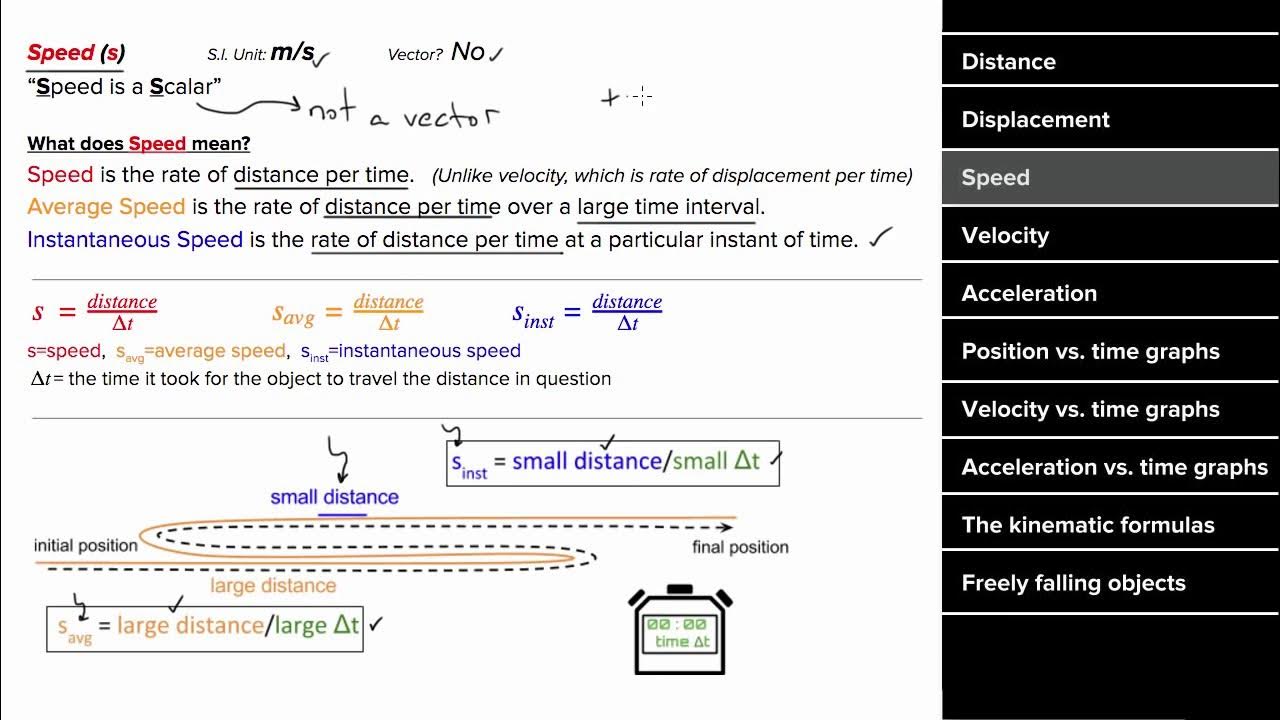
- 🕒 Average speed is calculated by dividing the total distance by the total time, measured in meters per second.
- ⏳ At certain time points, the person's location or displacement from the starting point can be read from the graph.
- 🛑 There are periods where the person does not move, indicated by a lack of change in displacement on the graph.
- 📉 Velocity, or the rate of change of displacement, can be calculated between two points in time, taking into account the direction of movement.
- 🔄 The direction of movement is crucial for determining whether the velocity is positive (right or east) or negative (left or west).
- 📏 The graph's scale and markings are essential for accurately reading displacement and time.
- 🤔 Understanding the graph and the calculations it represents is emphasized as important for grasping the concepts of distance, speed, and velocity.
Q & A
What is the total distance walked by the person in the first example?
-The total distance walked by the person is 12 meters, calculated by adding the distance walked to the right (4 meters) and the distance walked to the left (8 meters, which includes the 4 meters back to the house and then 4 meters to the left).
What is the average speed for the full 15 seconds in the first example?
-The average speed is 0.8 meters per second, which is calculated by dividing the total distance (12 meters) by the total time (15 seconds).
At 10 seconds, where is the person located in the first example?
-At 10 seconds, the person is located 4 meters to the left of their house, as indicated by the displacement graph.
What is the velocity between 5 and 10 seconds in the first example?
-The velocity between 5 and 10 seconds is 1.6 meters per second to the left, as calculated by the change in displacement (from +4 meters to -4 meters) divided by the change in time (5 seconds).
What is the total distance traveled by the person in the second example?
-The total distance traveled is 200 meters, which includes going 60 meters east, staying at 60 meters for a while, coming back 60 meters to the house, going 40 meters west, and then returning 40 meters back to the house.
What is the average speed for the full 55 seconds in the second example?
-The average speed is 3.64 meters per second, calculated by dividing the total distance (200 meters) by the total time (55 seconds).
Describe the location of the person at 30 seconds in the second example.
-At 30 seconds, the person is back at the house, which is the starting position with a displacement of zero meters.
What is the velocity between 15 and 40 seconds in the second example?
-The velocity between 15 and 40 seconds is 4 meters per second to the west, calculated by the change in displacement (from 60 meters to -40 meters) divided by the change in time (25 seconds).
How far does Sarah walk in total in the third example?
-Sarah walks a total of 6 meters, which includes walking 2 meters north, returning 2 meters to the starting position, walking 1 meter south, and then returning 1 meter to the starting position.
What is Sarah's velocity over the first two seconds in the third example?
-Sarah's velocity over the first two seconds is 1 meter per second to the north, as she moves from the starting position to a displacement of 2 meters.
What is the velocity between 4 and 6 seconds for Sarah in the third example?
-The velocity between 4 and 6 seconds is -1.5 meters per second to the south, calculated by the change in displacement (from 2 meters to -1 meter) divided by the change in time (2 seconds).
What is the total distance traveled by Greg in the fourth example?
-The total distance traveled by Greg is 200 meters, which includes going 8 meters west, returning 8 meters back to the start, going 8 meters east, staying at -8 meters for a while, and then returning 8 meters back to the start.
What is the average velocity between 30 and 50 seconds in the fourth example?
-The average velocity between 30 and 50 seconds is 4 meters per second to the west, calculated by the change in displacement (from 40 meters to -40 meters) divided by the change in time (20 seconds).
What is the velocity for the first 30 seconds in the fourth example?
-The velocity for the first 30 seconds is 1.33 meters per second to the east, calculated by the change in displacement (from 0 meters to 40 meters) divided by the change in time (30 seconds).
Outlines
🚶 Displacement and Time Graphs: Understanding Walks and Positions
The first paragraph introduces the concept of displacement and time graphs, focusing on a person's walk as an example. It explains the starting position (the house), the direction of movement (right as positive), and how the person's walk is represented on a number line. The person walks to a point four meters away, returns to the house, and then walks to a point four meters to the left. The paragraph also discusses how to calculate total distance walked, average speed, and the person's location at specific times. It emphasizes the importance of understanding the graph to answer related questions accurately.
🚴♂️ Analyzing Bicycle Rides and Calculating Velocities
The second paragraph explores another scenario where a person starts a bicycle ride from their house. It covers the concept of eastward movement being positive and how the person's journey is depicted on a graph. The person travels 60 meters east, remains stationary, returns to the house, then travels 40 meters west, and finally comes back to the house. Questions related to total distance, average speed, and specific locations at given times are addressed. The paragraph concludes with a method to calculate velocity between two time intervals, emphasizing the need to understand the graph's details.
🏃♀️ Sarah's Walk: Distance, Displacement, and Velocity Calculations
The third paragraph describes Sarah's walk, detailing her movements north and south from her starting position. It explains how to calculate the total distance Sarah walks, her position at specific times, and her velocity during different intervals of her walk. The summary clarifies the difference between distance (scalar) and displacement (vector) and how to calculate velocity as a change in displacement over time. It also addresses a scenario where Sarah is stationary and confirms her velocity as zero during that period.
🏃 Greg's Sprinting Story: Positive and Negative Displacements
The fourth paragraph presents Greg's sprinting scenario with westward movement considered positive. It outlines Greg's movements, including going to a point eight meters west, remaining stationary, returning to the starting position, and then sprinting eastward. The summary includes questions about Greg's velocity during different time intervals, emphasizing how to calculate velocity and the importance of understanding the direction of movement in relation to positive and negative displacements.
🚣 Boat's Movement: Understanding Displacement and Velocity
The fifth paragraph discusses a boat's movement with a focus on displacement and velocity. It illustrates the boat's journey from positive 40 meters east to negative 40 meters west and finally back to the starting position. The summary provides calculations for average velocity between specific time intervals and the total distance traveled by the boat. It also addresses a period where the boat remains stationary and confirms the velocity as zero during that time.
📏 Total Distance Calculation: Summing Up the Displacements
The sixth paragraph concludes the script by calculating the total distance traveled, which involves adding up all the individual distances covered during the movements. It provides a clear breakdown of the distances for each part of the journey, resulting in a total distance of 200 meters. This final summary reinforces the concept of total distance as the sum of all movements, regardless of direction.
Mindmap
Keywords
💡Displacement
💡Time
💡Distance
💡Speed
💡Velocity
💡Positive and Negative Values
💡Graphs
💡Scalar and Vector Quantities
💡Starting Position
💡Average Velocity
💡Total Distance Traveled
Highlights
A person starts a walk from their house, with the starting position marked as zero on a number line.
Displacement is represented on a graph, with rightward movement considered positive and leftward as negative.
The person walks 4 meters to the right, then turns around and walks back to the house, reaching the zero position.
After returning to the house, the person walks 4 meters to the left, reaching a displacement of -4 meters.
During a certain period, the person does not move, as indicated by no change in displacement from -4 meters.
Total distance walked by the person is calculated as the sum of individual movements, totaling 12 meters.
Average speed is calculated using the formula speed = distance/time, resulting in 0.8 meters per second.
The person's location at 10 seconds is 4 meters to the left of the house, and at 15 seconds, they remain in the same position.
Velocity between 5 and 10 seconds is determined by the change in displacement over time, resulting in 1.6 meters per second to the left.
A bicycle ride is analyzed with the starting position at the house and eastward movement considered positive.
The total distance traveled during the bicycle ride is calculated as 200 meters, with an average speed of 3.64 meters per second over 55 seconds.
Sarah's walk is described with northward movement as positive, and her total walking distance is 6 meters.
Sarah's position at seven seconds is 1 meter south of the starting position, and at 35 seconds, she is 20 meters west of the house.
Velocity calculations for different time intervals for Sarah's walk result in various directional movements and speeds.
Greg's sprinting example is introduced with westward movement as positive, and his movements are tracked on a graph.
Velocity calculations for Greg's sprinting intervals show changes in direction and speed, including periods of no movement.
An example of a boat's movement is analyzed, with calculations for average velocity and total distance traveled.
The boat's movement from points G to H indicates no movement, and the total distance traveled is 200 meters.
Transcripts
Browse More Related Video
AP Physics 1 review of 1D motion
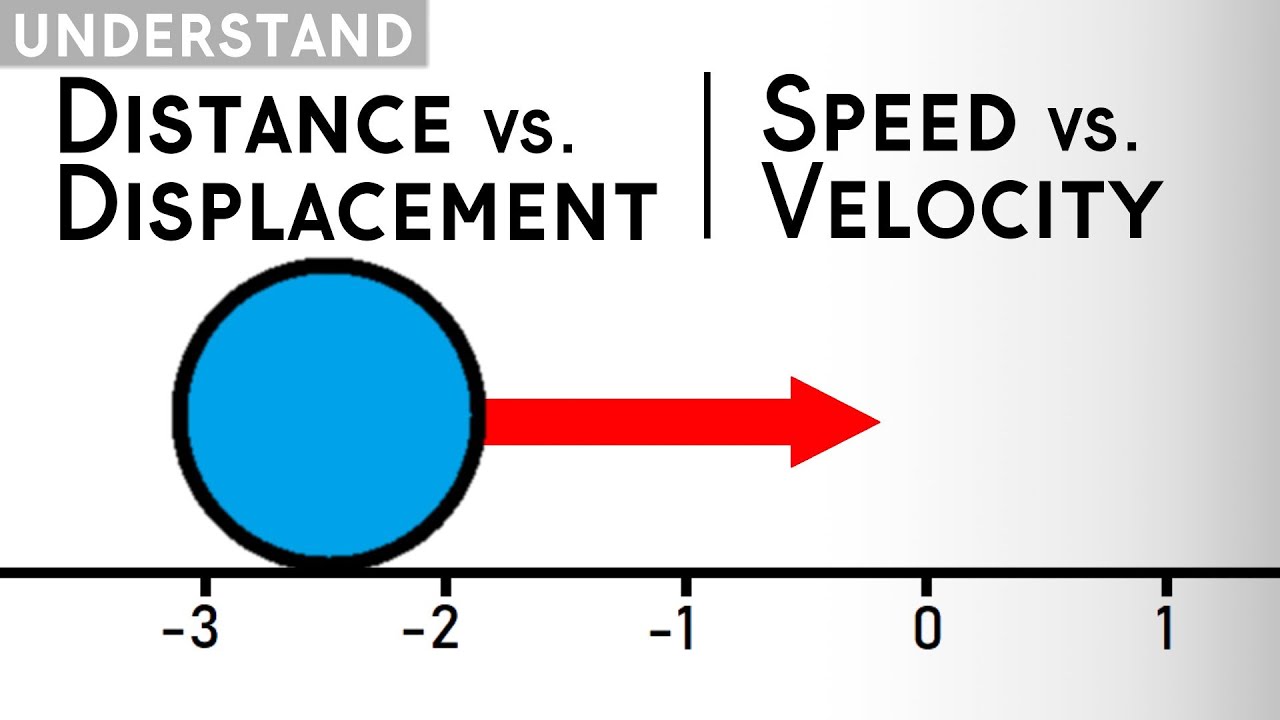
Distance vs. Displacement & Speed vs. Velocity | Kinematics Explained

What is Velocity? Physics

Displacement and Velocity - How is it different from Distance and Speed? | Physics
Distance, Displacement, Speed and Velocity
Motion problems with integrals: displacement vs. distance | AP Calculus AB | Khan Academy
5.0 / 5 (0 votes)
Thanks for rating: