Nominal, ordinal, interval and ratio data: How to Remember the differences
TLDRThis educational video script introduces the concept of levels of measurement in quantitative research, emphasizing their impact on statistical analysis and conclusions. It outlines four levels: nominal, ordinal, interval, and ratio, from lowest to highest, explaining each with examples and implications for statistical tests. The script encourages researchers to collect data at the highest level possible for more robust analysis and provides a mnemonic, NOIR, to remember the order. It also cautions against misapplying statistical tests based on the level of measurement and invites viewers to consider controversial examples and engage in discussion.
Takeaways
- 📊 Quantitative researchers must choose the appropriate level of measurement for their variables to ensure valid statistical analysis.
- 🔢 The level of measurement impacts the types of statistical tests that can be performed and the conclusions that can be drawn from the data.
- 🚀 Higher levels of measurement allow for more statistical tests, making it ideal to use the highest level possible when collecting data.
- 🔤 The acronym NOIR can be used to remember the order of nominal, ordinal, interval, and ratio levels of measurement from lowest to highest.
- 🧐 The nature of the variable and the data collection method determine the level of measurement that can be applied.
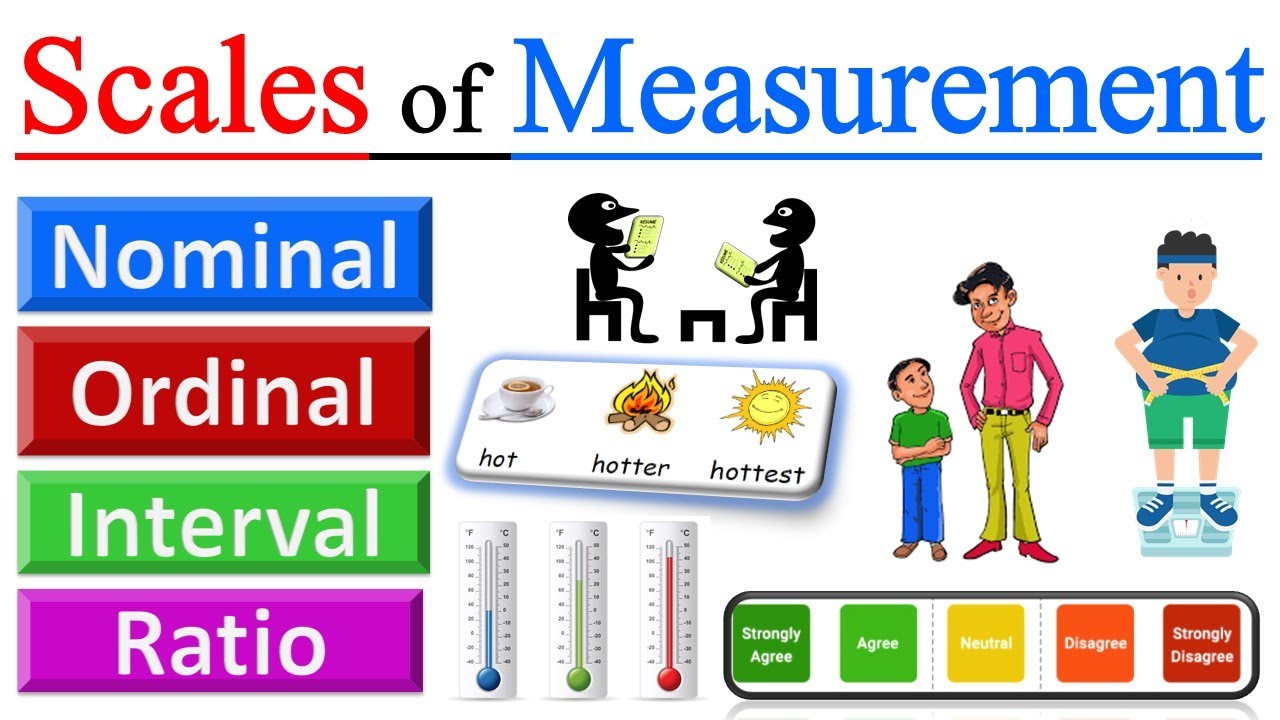
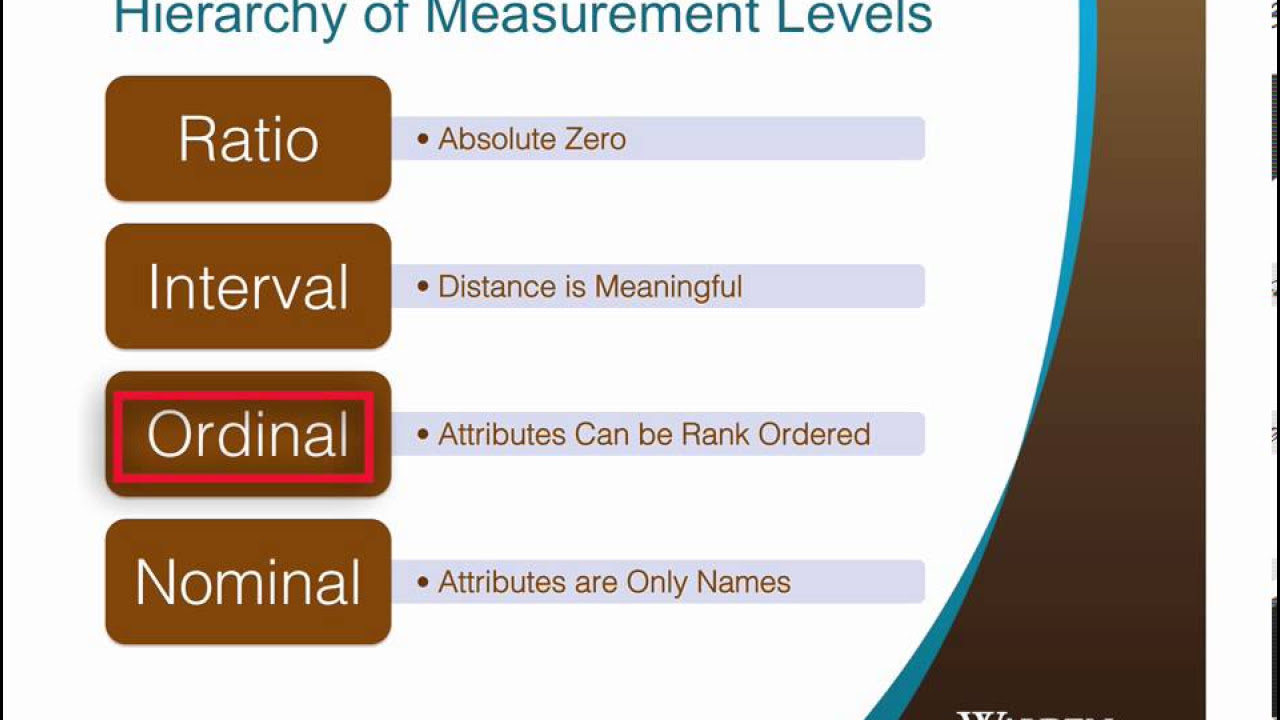
- 🏷 Nominal is the lowest level of measurement, involving categories with no inherent order, such as gender or hair color.
- 📊 Ordinal data is categorical with a natural order, like satisfaction levels or pain scales, but without equal intervals or a true zero.
- 🌡️ Interval data is ordered with known and equal intervals between values, such as test scores or temperature readings.
- 📏 Ratio measurement is the highest level, with an absolute zero and known intervals, applicable to physical measurements like height and weight.
- 📈 The level of measurement dictates which statistical tests can be used, with nominal allowing the fewest and ratio allowing the most.
- ❗ Researchers must avoid misinterpreting data by assigning inappropriate levels of measurement, such as treating ordinal data as interval data.
- 🤔 Understanding levels of measurement is crucial for both conducting and critiquing research, and for avoiding common mistakes in data analysis.
Q & A
Why is the level of measurement important in quantitative research?
-The level of measurement is crucial in quantitative research because it determines the type of statistical tests that can be applied to the data and the conclusions that can be drawn from them. Higher levels of measurement allow for more sophisticated statistical analyses.
What are the four levels of measurement described in the video?
-The four levels of measurement described in the video are nominal, ordinal, interval, and ratio, each with increasing complexity and capability for statistical analysis.
How can the acronym NOIR help in remembering the order of measurement levels?
-NOIR is an acronym that stands for Nominal, Ordinal, Interval, and Ratio, which helps in remembering the order of measurement levels from the lowest to the highest.
What is the nominal level of measurement and how is it characterized?
-The nominal level of measurement is the lowest level, where variables are placed into mutually exclusive categories without a natural order. Numbers may be assigned to these categories, but they serve only as labels and do not imply any quantitative difference.
What types of data are considered nominal and why?
-Nominal data includes dichotomous data, such as Male/Female or Yes/No, and categorical data with more than two possible values like marital status or group membership. They are considered nominal because they involve naming categories without implying any order or quantitative difference.
What is the significance of the mode in nominal data?
-In nominal data, the mode is the only measure of central tendency that makes sense, as it represents the most frequently occurring category. Other measures like mean, median, and standard deviation are not applicable due to the lack of order and quantitative difference.
How does ordinal data differ from nominal data?
-Ordinal data differs from nominal data in that the categories have a natural order. Numbers are assigned to establish a ranking, but the intervals between these numbers are not necessarily equal, and there is no absolute zero.
What are some examples of ordinal data and how are they used?
-Examples of ordinal data include customer satisfaction scales and pain scales used by nurses, where participants rank their responses on an ordered scale. These scales are used to determine the relative order of responses but cannot accurately measure the distance between each category.
What is the key characteristic of interval level data?
-Interval level data is characterized by an ordered scale with equal intervals between each value. However, the zero point is arbitrary and does not signify the absence of the variable being measured.
How does ratio level data differ from interval level data?
-Ratio level data, like interval data, is ordered with known and measurable intervals between values. The key difference is that ratio data has an absolute zero, which signifies the absence of the characteristic being measured.
What are some examples of ratio level data?
-Examples of ratio level data include physical measurements such as height, weight, and length, where a value of zero indicates the absence of the characteristic and ratios between measurements can be compared.
Why is it important to know the level of measurement when analyzing data?
-Knowing the level of measurement is important for selecting the appropriate statistical tests to analyze the data. It helps avoid errors in data interpretation and ensures that the conclusions drawn are valid and meaningful.
What are some controversial examples where the level of measurement might be debated?
-Controversial examples include the measurement of intelligence, which some researchers treat as ordinal and others as interval, and money in a bank account, which could be considered ratio due to a zero balance indicating no money, or interval due to the possibility of a negative balance.
Outlines
📊 Understanding Levels of Measurement in Research
This paragraph introduces the concept of levels of measurement in quantitative research and emphasizes their importance in determining the statistical tests that can be applied to data. It outlines the four levels of measurement: nominal, ordinal, interval, and ratio, from lowest to highest. The paragraph explains that higher levels allow for more statistical tests and encourages the use of the highest level possible when collecting data. It also introduces the acronym NOIR for remembering the order of these levels and discusses how the nature of a variable and the method of data collection determine its level of measurement. The nominal level is described as the simplest, involving categorization without inherent order, while ordinal levels introduce a natural order without equal intervals. Examples such as gender for nominal and customer satisfaction or pain scales for ordinal are provided to illustrate these concepts.
📈 Expanding on Ordinal and Higher Levels of Measurement
This paragraph delves deeper into the characteristics and implications of ordinal, interval, and ratio levels of measurement. It clarifies that ordinal data, while ordered, does not have equal intervals or a true zero, limiting the statistical tests that can be used. Interval data, on the other hand, is ordered with equal intervals and an arbitrary zero, allowing for more statistical tests like mean, median, mode, and standard deviation calculations. Ratio data is distinguished by having an absolute zero, which enables ratio comparisons and the application of any statistical test. The paragraph provides examples such as school tests, temperature measurements, and physical measurements like height and weight to illustrate these levels. It also discusses the importance of correctly identifying the level of measurement to avoid statistical errors and the potential for debate in classifying certain types of data, such as intelligence or bank account balances.
🗨️ Engaging with the Community on Data Measurement
The final paragraph shifts focus from the technical aspects of measurement levels to practical engagement and application. It encourages viewers to consider how data collection methods determine the level of measurement and the appropriateness of statistical tests. The paragraph advises researchers to aim for the highest level of data collection possible to allow for a broader range of tests. It also highlights the importance of question phrasing in determining data level and warns against common mistakes, such as averaging non-numeric data like marital status. The video script concludes with an invitation for viewers to engage in discussion, create study aids, and subscribe for updates, offering assistance for specific inquiries and encouraging feedback.
Mindmap
Keywords
💡Quantitative researchers
💡Level of measurement
💡Nominal
💡Ordinal
💡Interval
💡Ratio
💡Statistical tests
💡Acronyms NOIR or noir
💡Mode
💡Median
💡Mean
Highlights
Quantitative researchers measure variables to answer their research questions.
The level of measurement impacts the type of statistical tests that can be conducted and conclusions drawn.
Higher levels of measurement allow for more statistical tests to be run with data.
It is recommended to use the highest level of measurement possible when collecting information.
The video describes nominal, ordinal, interval, and ratio levels of data from lowest to highest.
By the end of the video, viewers should be able to identify the level of measurement used in a study.
Viewers will also learn about the types of tests that can be done with each level of measurement.
The acronym NOIR or noir can be used to remember the order of measurement levels.
The level of measurement of a variable depends on its nature and the data collection method.
Nominal level is the lowest level of measurement, with variables placed into mutually exclusive categories.
Nominal data is categorical and does not have a natural order, limiting the statistical tests that can be applied.
Ordinal data has a natural order to categories, allowing for limited comparisons beyond nominal level tests.
Interval level data is ordered with known and equal intervals between values, allowing for more statistical tests.
Ratio measurement is the highest level, with an absolute zero and known intervals, enabling all statistical tests.
The level of measurement dictates the appropriate statistical tests that can be used on the data.
Researchers should be cautious not to make interval or ratio claims about ordinal data.
Controversies exist in classifying some forms of data, such as intelligence measurement or bank account balances.
Understanding levels of measurement helps avoid mistakes in statistical analysis and critique of research.
Data collection methods can determine the level of measurement, influencing the types of statistical tests used.
Creating a study table with examples can help remember the levels of measurement and their characteristics.
Transcripts
Browse More Related Video
Scales of Measurement in Statistics - Nominal, Ordinal, Interval, Ratio | Level of Measurement
Nominal, Ordinal, Interval & Ratio Data: Simple Explanation With Examples

Introduction to Statistics: Levels of Measurement
Scales of Measurement
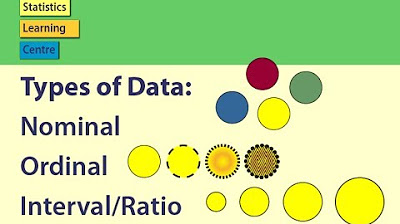
Types of Data: Nominal, Ordinal, Interval/Ratio - Statistics Help
Introduction to Levels of Measurement: Nominal, Ordinal, Interval, Ratio
5.0 / 5 (0 votes)
Thanks for rating: