Critical value (z*) for a given confidence level | AP Statistics | Khan Academy
TLDRThe video script explains the process of constructing a one-sample z interval to estimate the proportion of defective computers in a factory. Elena, the instructor, uses a 94% confidence level with a sample of 200 computers, finding 12 defects. The focus is on determining the critical z value (z star) for the interval. The script clarifies the concept of confidence intervals, the importance of the z value in capturing the desired area under the curve, and guides through the process of finding the z value from a z-table, concluding with a z star of 1.88 for the 94% confidence interval.
Takeaways
- 📚 Elena is constructing a one-sample z interval to estimate the proportion of computers with a defect at a factory.
- 🔢 She has chosen a confidence level of 94% for her interval estimation.
- 💻 A sample of 200 computers revealed that 12 had the defect, which will be used to calculate the sample proportion.
- 📉 The concept of a confidence interval is explained, emphasizing its purpose to estimate the true population parameter.
- 🎯 The script explains that a 94% confidence interval means that 94% of such intervals would contain the true population parameter if the sampling were repeated many times.
- 📊 The critical value, z star, is discussed as the number of standard deviations that define the width of the confidence interval.
- 🔍 The standard error of the statistic is mentioned as a component in calculating the confidence interval, but it's not the focus of the critical value determination.
- 📚 The importance of using a z-table or calculator correctly is highlighted, especially considering the type of area (one-tailed or two-tailed) the table or calculator provides.
- 📈 The process of finding z star involves looking for the z value that leaves 3% in the tails of the distribution, corresponding to the 94% confidence level.
- 🔢 The script provides a practical example of looking up the z value in a z-table, identifying 1.88 as the critical value for a 94% confidence interval.
- 📝 The final takeaway is the identification of the critical z value, z star, as 1.88 for constructing Elena's confidence interval.
Q & A
What is the purpose of a one-sample z interval in statistics?
-A one-sample z interval is used to estimate a population parameter, such as the proportion of computers with a certain defect in this case, when the true population parameter is unknown.
What is the significance of the 94% confidence level in this scenario?
-A 94% confidence level means that if we were to repeatedly construct confidence intervals using random samples, approximately 94% of these intervals would contain the true population proportion.
What is the sample size in Elena's study of computer defects?
-Elena's sample size is 200 computers.
How many computers with defects were found in Elena's sample?
-In the sample of 200 computers, 12 were found to have the defect.
What is the critical value z star used for in constructing a confidence interval?
-The critical value z star is used to determine the number of standard deviations above and below the sample statistic to capture the desired confidence level.
Why is it necessary to look up the critical value z star in a z-table or calculator?
-The critical value z star is needed to find the number of standard deviations that correspond to the desired confidence level, which is not known a priori and must be determined from a standard normal distribution.
What is the standard error of the statistic in the context of this script?
-The standard error is the standard deviation of the sampling distribution of the sample proportion, which is used in calculating the confidence interval.
How is the standard error of the sample proportion calculated?
-The standard error is calculated as the square root of the product of the sample proportion and its complement, divided by the sample size.
What does the z-table represent and how is it used?
-A z-table represents the cumulative area under the standard normal curve up to a certain number of standard deviations from the mean. It is used to find the critical value z star that corresponds to the desired confidence level.
How does the symmetry of the normal distribution affect the calculation of the confidence interval?
-The symmetry means that the confidence interval is calculated by taking the sample statistic plus or minus the critical value z star times the standard error, ensuring that the desired confidence level is maintained.
What is the critical value z star that Elena should use for her 94% confidence interval?
-Elena should use a critical value z star of 1.88 for her 94% confidence interval.
Outlines
📊 Understanding Confidence Intervals and Critical Values
In this paragraph, the instructor discusses the concept of a one-sample z interval used to estimate the proportion of computers with a certain defect at a factory. Elena, the subject of the scenario, selects a 94% confidence level for her interval. The instructor explains the purpose of confidence intervals and how they are used to estimate the true population parameter, in this case, the proportion of defective computers. A random sample of 200 computers reveals 12 defects, leading to the calculation of a sample proportion. The instructor emphasizes the importance of the critical value, z star, in constructing the confidence interval, which represents the number of standard deviations from the mean that capture 94% of the probability. The explanation includes the process of looking up z values on a z-table and the significance of the symmetric distribution of the remaining 6% of the area around the mean.
🔍 Calculating the Critical Z Value for a 94% Confidence Interval
The instructor continues the discussion by focusing on finding the specific critical z value, z star, needed for a 94% confidence interval. Using a z-table provided for AP Statistics, the instructor demonstrates how to locate the z value that corresponds to 97% of the area under the standard normal curve, which leaves 3% in the tails, thus achieving the desired 94% confidence level. The z-table is used to find the closest z value to 97%, which is approximately 1.88. This z value is then used to construct the confidence interval, indicating that 94% of such intervals would contain the true population parameter if the sampling were repeated multiple times.
Mindmap
Keywords
💡Confidence Interval
💡Population Proportion
💡Sample Proportion
💡Critical Value
💡Z-Table
💡Standard Deviation
💡Standard Error
💡Sampling Distribution
💡True Population Parameter
💡Random Sample
💡Margin of Error
Highlights
Elena aims to construct a one-sample z interval to estimate the proportion of defective computers in a factory.
Confidence level chosen is 94%, which implies that 94% of such intervals will contain the true population parameter.
A random sample of 200 computers reveals 12 defective units.
The concept of a critical value z star is introduced for constructing the confidence interval.
The critical value z star is determined by the desired confidence level and the standard deviation of the sampling distribution.
The true population proportion is unknown, hence it is estimated through the sample proportion.
The standard error of the statistic is used in the calculation of the confidence interval.
The sampling distribution is assumed to be normal for the purpose of calculating the confidence interval.
The z-table is used to find the critical value that corresponds to the desired confidence level.
Z-tables and calculator functions may present cumulative area from negative infinity to z, which needs careful interpretation.
The critical value z star is found by looking for the z that leaves 3% in the tails, corresponding to 97% coverage.
The z-table is consulted to find the z value that corresponds to 97% of the area under the curve.
The critical z value z star is determined to be 1.88 for a 94% confidence interval.
The process of finding z star involves understanding the symmetry of the normal distribution and the concept of cumulative area.
The calculated z star value is crucial for constructing the confidence interval around the sample proportion.
The importance of using the correct z-table or calculator function for accurate critical value determination is emphasized.
The final calculated z star value of 1.88 is used to complete the construction of the confidence interval.
Transcripts
Browse More Related Video

Confidence Interval for a population proportion | Solved Problems
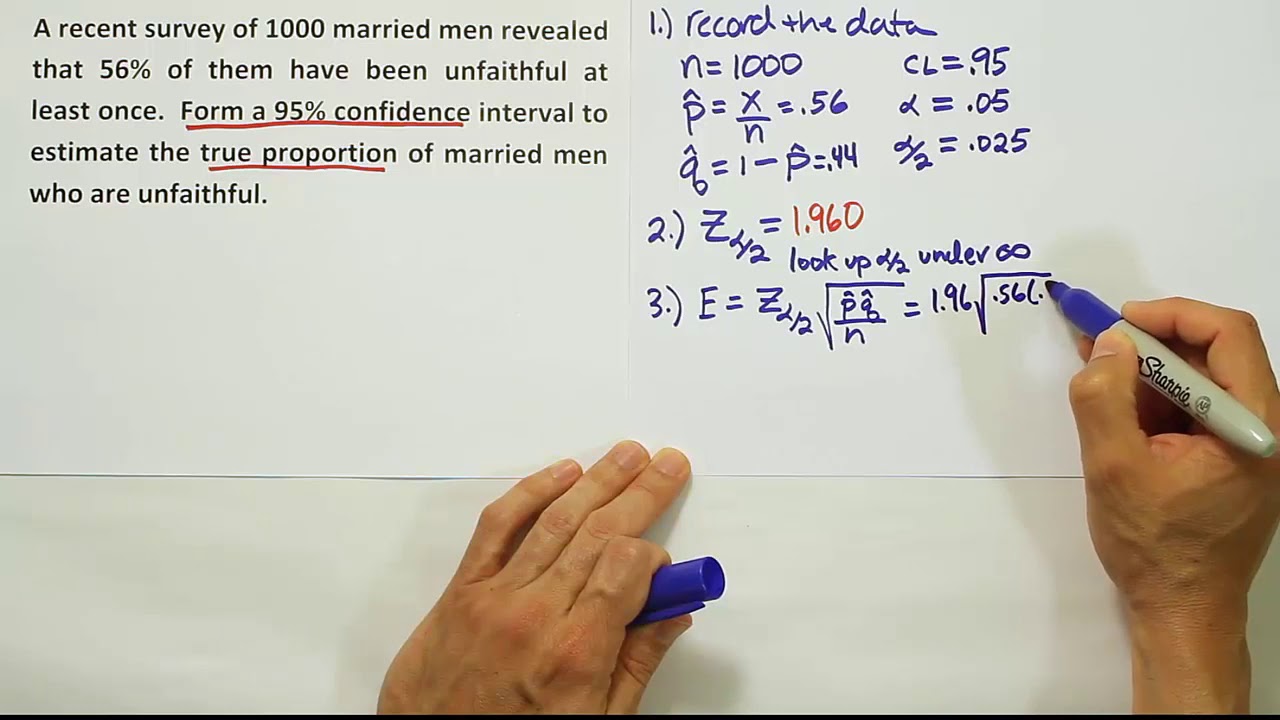
How to construct a confidence interval for the proportion, an example

Confidence interval example | Inferential statistics | Probability and Statistics | Khan Academy
Confidence Intervals | Population Mean: σ Unknown

Find the z-score given the confidence level

Confidence Intervals for Population Proportions
5.0 / 5 (0 votes)
Thanks for rating: