Calculating Expected values and Chi Squared Values
TLDRThis video script offers an educational walkthrough on calculating expected values and the chi-squared statistic in a hypothesis testing scenario. The example involves surveying 60 individuals, divided by age, to determine if those over 21 are more likely to pass their driver's test on the first attempt. The script guides viewers through the process of tallying observed values, calculating expected frequencies using the formula (row total * column total) / total sample size, and then deriving the chi-squared value by comparing observed and expected results. The chi-squared value, obtained through a series of calculations, will be utilized in subsequent videos to assess the significance of the observed age-passing rate relationship.
Takeaways
- 📚 The video introduces the concept of chi-squared testing and its terminology and formulas.
- 🔍 The example involves surveying 60 people to determine if age over 21 correlates with passing a driver's test on the first attempt.
- 👥 The sample consists of 40 people over 21 and 20 people under 21, with results categorized by pass/fail for each age group.
- 📊 The observed values are recorded, showing 36 people over 21 passed, 12 under 21 passed, 4 over 21 failed, and 8 under 21 failed.
- 🧮 The expected values are calculated using the formula: (row total * column total) / total number of people, to determine what should happen in a normal distribution.
- 📝 The expected values calculated are 32 over 21 passing, 16 under 21 passing, 8 over 21 failing, and 4 under 21 failing.
- 📉 The observed and expected values are compared to identify any significant differences that may suggest a non-random relationship between age and test results.
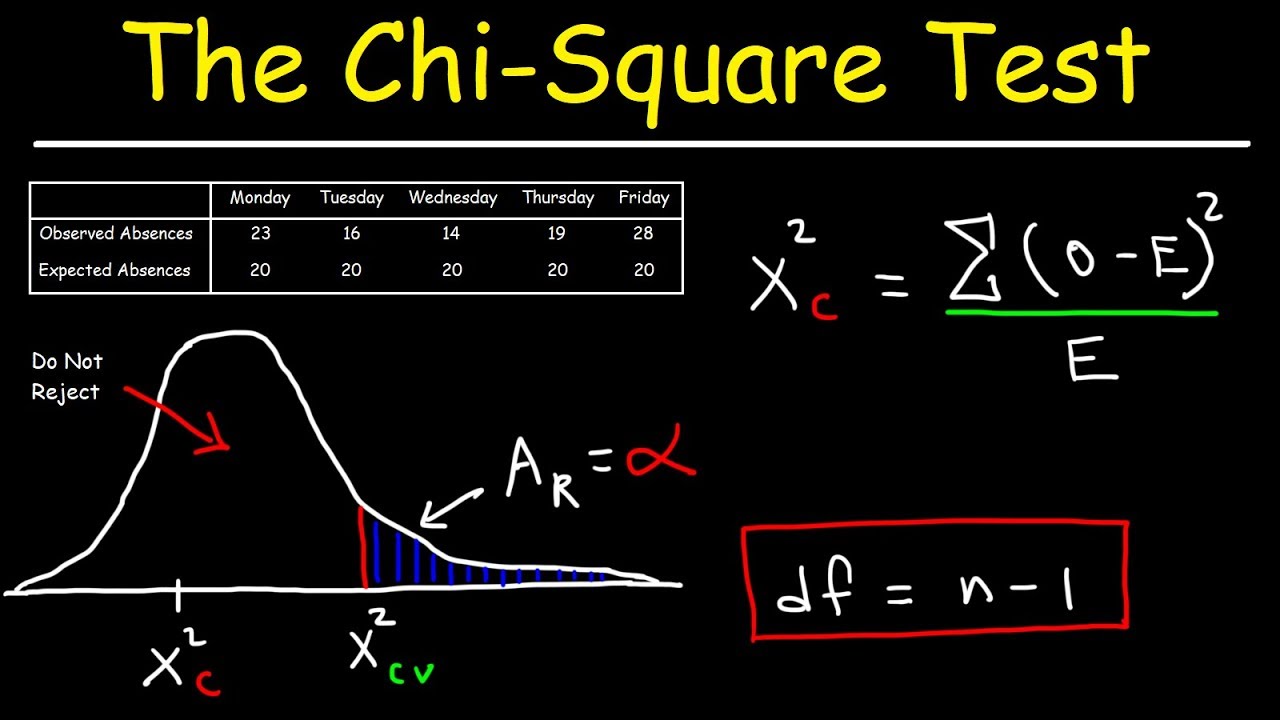
- 🔢 The chi-squared value is calculated using the formula: (O - E)^2 / E, where O is the observed value and E is the expected value.
- 📈 A contingency table is set up to organize the observed and expected values for the chi-squared calculation.
- 📚 The chi-squared value obtained, 7.5 in this example, will be used in further analysis to test the hypothesis regarding the relationship between age and passing the driver's test.
Q & A
What is the purpose of the chi-squared test introduced in the video?
-The purpose of the chi-squared test is to determine if there is a significant association between two variables, in this case, age and the likelihood of passing a driver's test on the first attempt.
What are the steps for calculating expected values in a chi-squared test as described in the video?
-The steps for calculating expected values involve multiplying the row total by the column total and then dividing by the total number of people in the sample.
How many people over 21 were surveyed in the example provided in the video?
-In the example, 40 people over the age of 21 were surveyed.
How many people under 21 were surveyed in the example provided in the video?
-In the example, 20 people under the age of 21 were surveyed.
What is the observed number of people over 21 who passed their driver's test the first time in the example?
-The observed number of people over 21 who passed their driver's test the first time is 36.
What is the observed number of people under 21 who passed their driver's test the first time in the example?
-The observed number of people under 21 who passed their driver's test the first time is 12.
What is the expected number of people over 21 who should have passed their driver's test the first time according to the video?
-The expected number of people over 21 who should have passed their driver's test the first time is 32.
What is the expected number of people under 21 who should have passed their driver's test the first time according to the video?
-The expected number of people under 21 who should have passed their driver's test the first time is 16.
How is the chi-squared value calculated in the video?
-The chi-squared value is calculated by taking the difference between the observed and expected values, squaring the result, and then dividing by the expected value.
What is the calculated chi-squared value in the example provided in the video?
-The calculated chi-squared value in the example is 7.5.
What does the chi-squared value represent in the context of the test?
-The chi-squared value represents the extent of the difference between the observed data and the expected data under the null hypothesis. A higher chi-squared value suggests a greater difference and potentially a significant association between the variables.
Outlines
📊 Introduction to Chi-Squared and Expected Values
The video begins with a recap of the introduction to chi-squared tests, terminology, and formulas. The focus then shifts to calculating expected values for a sample and the chi-squared value. An example is presented involving observing 60 people and asking whether they passed their driver's test the first time, categorized by age over or under 21. The observed data is collected and organized into a contingency table. The video emphasizes not to worry about the seven steps of hypothesis testing yet, as they will be covered in later videos. The audience is encouraged to write down the example and use a PDF for reference to save time.
🧮 Calculating Expected Values and Chi-Squared
This paragraph explains the process of calculating expected values in a normal distribution. The observed totals for passing and failing the driver's test are calculated, and then the expected values are computed using the formula: (row total * column total) / total number of people. The expected values for each age group, both for those who passed and failed, are calculated. The video shows the calculations for each cell in the contingency table, resulting in expected values of 32, 16, 8, and 4 for the respective categories. These expected values are then used to calculate the chi-squared value, which is a key component in hypothesis testing to determine if there is a significant relationship between age and passing the driver's test on the first attempt.
🔢 Chi-Squared Calculation and Interpretation
The final paragraph details the calculation of the chi-squared value using the observed and expected values from the previous step. The formula for chi-squared is demonstrated, which involves taking the difference between observed and expected values, squaring it, and then dividing by the expected value. Each cell in the contingency table is processed this way, and the results are summed to obtain the chi-squared value. The example provided results in a chi-squared value of 7.5. This value will be used in subsequent videos to perform hypothesis testing and determine the statistical significance of the observed data regarding the relationship between age and passing the driver's test on the first attempt.
Mindmap
Keywords
💡Chi-squared
💡Expected Values
💡Observed Values
💡Hypothesis Testing
💡Contingency Table
💡Normal Distribution
💡Chi-squared Value
💡Null Hypothesis
💡Sample
💡Statistical Significance
Highlights
Introduction to chi-squared and related terminology and formulas.
Explanation of calculating expected values in a sample for chi-squared analysis.
Presentation of an example involving 60 people and their driver's test outcomes.
Collection of data on pass/fail rates for people over and under 21 years old.
Totals calculation for people who passed and failed the test, regardless of age.
Summation of the number of people surveyed in each age group.
Hypothesis testing setup to determine if age affects passing the driver's test.
Assignment instructions to calculate expected values using a specific formula.
Description of the formula for calculating expected values in a chi-squared test.
Calculation of expected values for each age group and pass/fail category.
Comparison of observed values with expected values for the chi-squared test.
Detailed calculation steps for the chi-squared value using observed and expected data.
Presentation of the contingency table for organizing observed and expected values.
Final calculation of the chi-squared value and its significance in statistical analysis.
Explanation of the chi-squared value's role in hypothesis testing and further analysis.
Instruction to write down the entire slide for reference and clarity.
Transcripts
Browse More Related Video
Elementary Statistics - Chapter 11 Chi Square Goodness of Fit Test
Statistics 101: Introduction to the Chi-square Test

Chi Square Test of Independence | Statistics Tutorial #29| MarinStatsLectures
Chi Square Test
8.1.3 Basics of Hypothesis Testing - Computing and Interpreting Test Statistics
SPSS (10): Chi-Square Test
5.0 / 5 (0 votes)
Thanks for rating: