Chi Square Test of Independence | Statistics Tutorial #29| MarinStatsLectures
TLDRThe video discusses Pearson's chi-squared test of independence, a statistical method used to determine if there's a relationship between two categorical variables. It explains the test's nonparametric nature, its reliance on large sample sizes, and the theoretical chi-squared distribution. The video uses a study on the relationship between MMR vaccinations and autism as an example, illustrating the null hypothesis, expected values, and the calculation of the chi-squared statistic. It emphasizes the importance of understanding the underlying concepts rather than just the formulas. The video concludes by noting that the chi-squared test does not indicate the direction or strength of an association and highlights the importance of scientific evidence over anecdotal claims, particularly in the context of the MMR-autism debate.
Takeaways
- 🧪 The Pearson's chi-squared test is used to examine the relationship between two categorical variables and determine if they are independent.
- 🔬 The test requires that the groups formed by variable X are independent and that both variables have two or more levels.
- 📊 Chi-squared test is technically nonparametric but relies on a large sample size and uses the chi-squared distribution, making it similar to parametric methods.
- 📈 The test compares observed frequencies with expected frequencies, calculated under the null hypothesis of independence.
- 🎯 The null hypothesis states that there is no relationship between the variables, while the alternative hypothesis suggests there is a relationship.
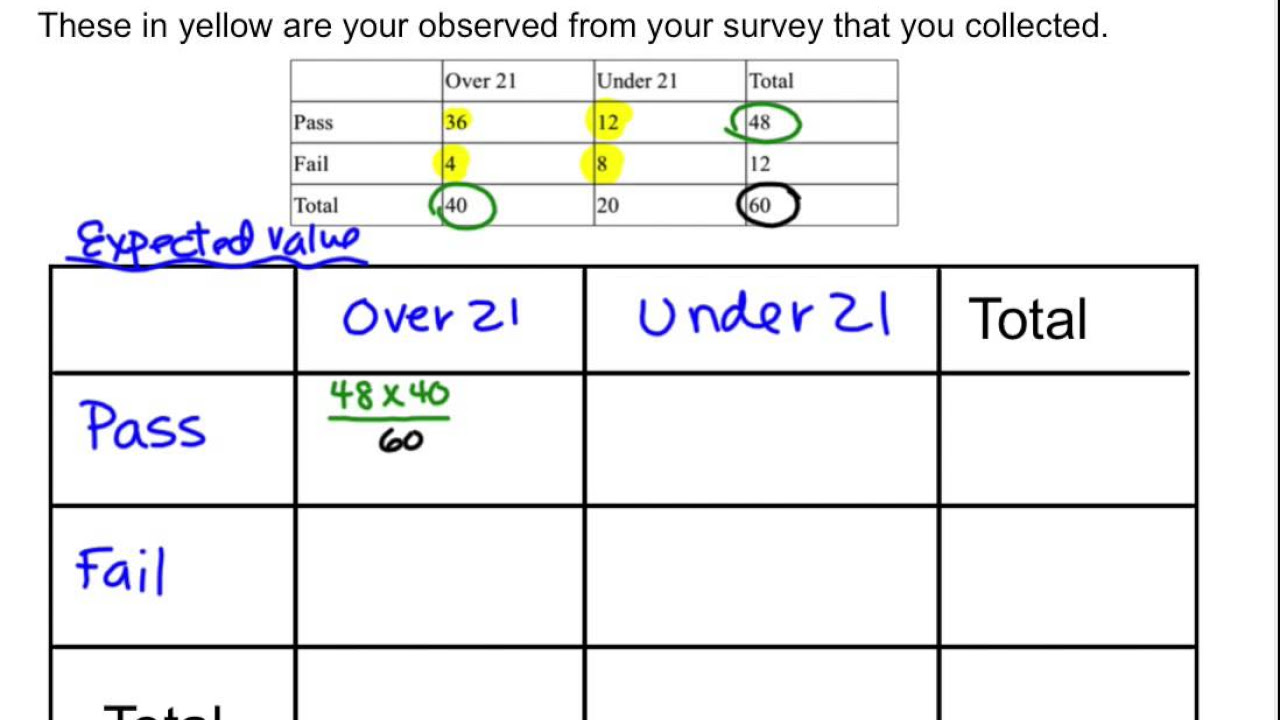
- 📝 The expected cell counts in the chi-squared test are derived from the row and column totals of the contingency table.
- 🔢 The degrees of freedom for the chi-squared test is determined by (number of rows - 1) * (number of columns - 1).
- 🎲 The test statistic follows a chi-squared distribution, which is used to calculate the p-value to make decisions about the null hypothesis.
- 🚫 The chi-squared test assumes all cells have counts greater than or equal to one and that observations are independent.
- 🛑 The test does not indicate the direction or strength of an association; for that, other measures like risk difference, risk ratio, or odds ratio are used.
- 💡 The script discusses a historical case of a falsified study linking MMR vaccination to autism, emphasizing the importance of scientific rigor and the pitfalls of misinformation.
Q & A
What is Pearson's chi-squared test of independence used for?
-Pearson's chi-squared test of independence is used to analyze the relationship between two categorical variables to determine if there is any association between them.
What is a requirement for the groups formed by variable X in a chi-squared test?
-The groups formed by variable X must be independent, meaning that the outcomes in one group do not influence or are related to the outcomes in the other group.
How does the chi-squared test relate to parametric methods like the t-test and analysis of variance?
-Although the chi-squared test is technically a nonparametric test, it relies on a large sample size and uses a theoretical probability distribution, making it similar to parametric methods like the t-test and analysis of variance.
What was the study published in the New England Journal of Medicine in 2002 investigating?
-The study was investigating whether there is any relationship between a child being vaccinated for MMR (measles, mumps, and rubella) and being diagnosed with autism.
What are the null and alternative hypotheses in the context of the MMR vaccination and autism study?
-The null hypothesis is that there is no relationship between MMR vaccination and autism diagnosis, meaning the probabilities of being diagnosed with autism are equal for vaccinated and unvaccinated children. The alternative hypothesis is that there is a relationship, indicating that the probability of autism diagnosis differs between vaccinated and unvaccinated children.
How is the expected table in a chi-squared test constructed?
-The expected table is constructed by using the row and column totals from the observed table, assuming that the null hypothesis is true and there is no association between the variables. The expected count for each cell is calculated as the product of the row total and the column total, divided by the overall total sample size.
What is the concept of degrees of freedom in the context of a chi-squared test?
-Degrees of freedom in a chi-squared test refer to the number of independent pieces of information that can vary freely in the test statistic. In a 2x2 contingency table, the degrees of freedom is 1, calculated as (number of rows - 1) times (number of columns - 1).
How is the chi-squared test statistic calculated?
-The chi-squared test statistic is calculated by summing the squared differences between the observed and expected cell counts, divided by the expected cell counts, for all cells in the table.
What is the significance of the p-value in hypothesis testing?
-The p-value in hypothesis testing represents the probability of observing the test statistic or something more extreme if the null hypothesis is true. It is used to decide whether to reject or fail to reject the null hypothesis based on a predetermined significance level, such as 5%.
What are the assumptions made in a chi-squared test?
-The assumptions made in a chi-squared test include that the groups are independent, the observations within each group are independent, all expected cell counts are greater than or equal to 5, and the sample size is large enough for the test statistic to approximate a chi-squared distribution.
What is the importance of understanding the underlying concepts and calculations in statistical tests?
-Understanding the underlying concepts and calculations is important because it provides insight into how statistical software arrives at its results, ensuring that we are not just using a 'black box' approach. It also helps in interpreting the results correctly and making informed decisions based on the data analysis.
What does the chi-squared test tell us about the association between two variables?
-The chi-squared test tells us whether there is evidence of an association between two variables but does not specify the direction or strength of that association. It is essentially a screening test to help decide if there is a potential association that warrants further investigation.
Outlines
📊 Introduction to Pearson's Chi-Squared Test
This paragraph introduces Pearson's Chi-Squared test of Independence, a statistical method used to analyze the relationship between two categorical variables. It emphasizes the requirement of independence in the groups formed by variable X and provides a brief overview of the test's nonparametric nature, despite its reliance on a large sample size and the Chi-Squared distribution. The paragraph sets the stage for a detailed discussion on how the test can be applied to a real-world example involving the relationship between MMR vaccination and autism diagnosis, starting with the null hypothesis of no association between the two variables.
🧠 Understanding Expected and Observed Frequencies
The paragraph delves into the concept of expected and observed frequencies in the context of the Chi-Squared test. It explains how the expected frequencies are calculated if the null hypothesis of independence between variables X and Y were true, using the row and column totals to determine the expected distribution of cases. The paragraph also introduces the idea of degrees of freedom in the context of the Chi-Squared test, highlighting that with four cells, only one degree of freedom is present once the row and column totals are fixed.
📈 Calculating the Chi-Squared Test Statistic
This section explains the process of calculating the Chi-Squared test statistic, which involves comparing the observed cell counts with the expected counts. The test statistic is derived by summing the squared differences between observed and expected frequencies, divided by the expected frequencies, for all cells in the table. The paragraph clarifies that the test statistic follows a Chi-Squared distribution if the null hypothesis is true and that the degrees of freedom are calculated as (number of rows - 1) times (number of columns - 1).
🎯 Interpreting the Chi-Squared Test Results
The paragraph discusses the interpretation of the Chi-Squared test results, focusing on the p-value as a guide to make decisions about the null hypothesis. It explains that if the p-value is greater than the alpha level (commonly 5%), the null hypothesis is not rejected, indicating no evidence of an association between the variables. The paragraph also cautions against overreliance on p-values, emphasizing the importance of understanding the underlying concepts and the limitations of statistical tests, especially with large sample sizes.
🚫 Addressing Misconceptions About Vaccinations and Autism
In this concluding paragraph, the speaker addresses the misconceptions surrounding the link between MMR vaccinations and autism, stemming from a discredited study. The speaker clarifies that there is no scientific evidence supporting a causal relationship between vaccinations and autism, and that the original study claiming such a link was found to be fraudulent and retracted. The paragraph serves as a reminder of the importance of critical evaluation of scientific claims and the potential harm caused by misinformation.
Mindmap
Keywords
💡Pearson's Chi-Squared Test
💡Independence
💡Categorical Variables
💡Null Hypothesis
💡Expected Frequencies
💡Degrees of Freedom
💡Test Statistic
💡P-Value
💡Large Sample Size
💡Fisher's Exact Test
💡Yates' Continuity Correction
Highlights
Pearson's chi-squared test of independence is discussed, a statistical method used to analyze the relationship between two categorical variables.
The requirement for the chi-squared test is that the groups formed by variable X are independent.
Technically, chi-squared test is a nonparametric test that relies on a large sample size and uses the chi-squared distribution.
The example used in the transcript is from a paper published in the New England Journal of Medicine in 2002, examining the relationship between MMR vaccination and autism diagnosis in children.
The null hypothesis for the example is that there is no relationship between MMR vaccination and autism diagnosis.
The main probabilities of interest are the sample estimates of the probability of developing autism given vaccination status.
The chi-square test is used to compare the observed data with expected data under the null hypothesis.
The expected table is constructed by keeping the row and column totals fixed and calculating the expected number of people in each cell.
The formula for the expected cell count is the row total times the column total divided by the overall total.
The chi-squared test statistic is calculated by summing the squared difference between observed and expected counts, divided by the expected count, for all cells in the table.
The test statistic follows a chi-squared distribution with degrees of freedom equal to (number of rows - 1) times (number of columns - 1).
The p-value is used to make a decision about the null hypothesis, with a larger p-value indicating failure to reject the null hypothesis.
The chi-squared test assumes independence of groups and observations, and that all cells have a count greater than or equal to one.
The test requires a large sample size and that all expected cell counts are greater than or equal to five.
The chi-squared test can be applied to tables with more than two levels for X or Y and does not require only two levels.
Yates' continuity correction is mentioned as a method to adjust for the discrete nature of the data when using a continuous distribution for calculating p-values.
The chi-squared test does not indicate the direction or strength of an association, and other measures like risk difference, risk ratio, or odds ratio can be used for this purpose.
The transcript addresses the anti-vaccination movement and emphasizes the lack of scientific evidence linking MMR vaccination to autism.
The fraudulent paper by Andrew Wakefield, which claimed a link between MMR vaccination and autism, is discussed, noting its retraction and the damage it caused.
Transcripts
Browse More Related Video
Calculating Expected values and Chi Squared Values

Chi-Square Test [Simply explained]
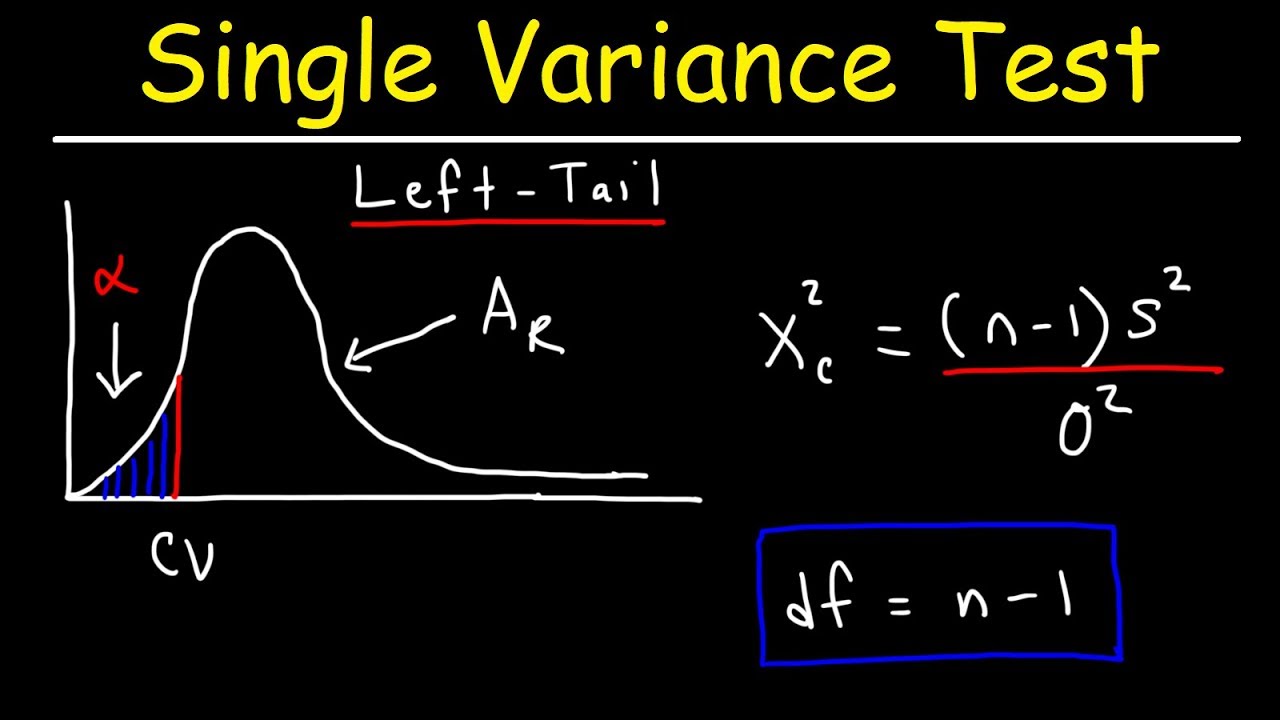
Chi Square Distribution Test of a Single Variance or Standard Deviation
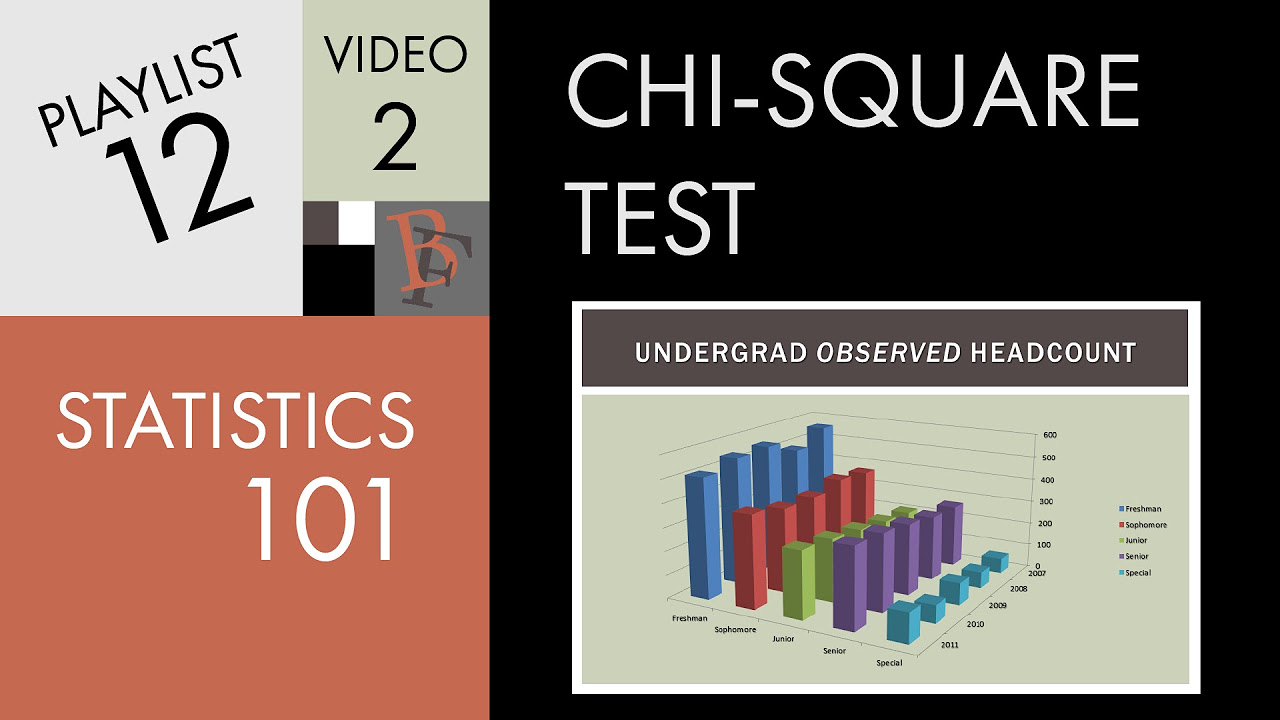
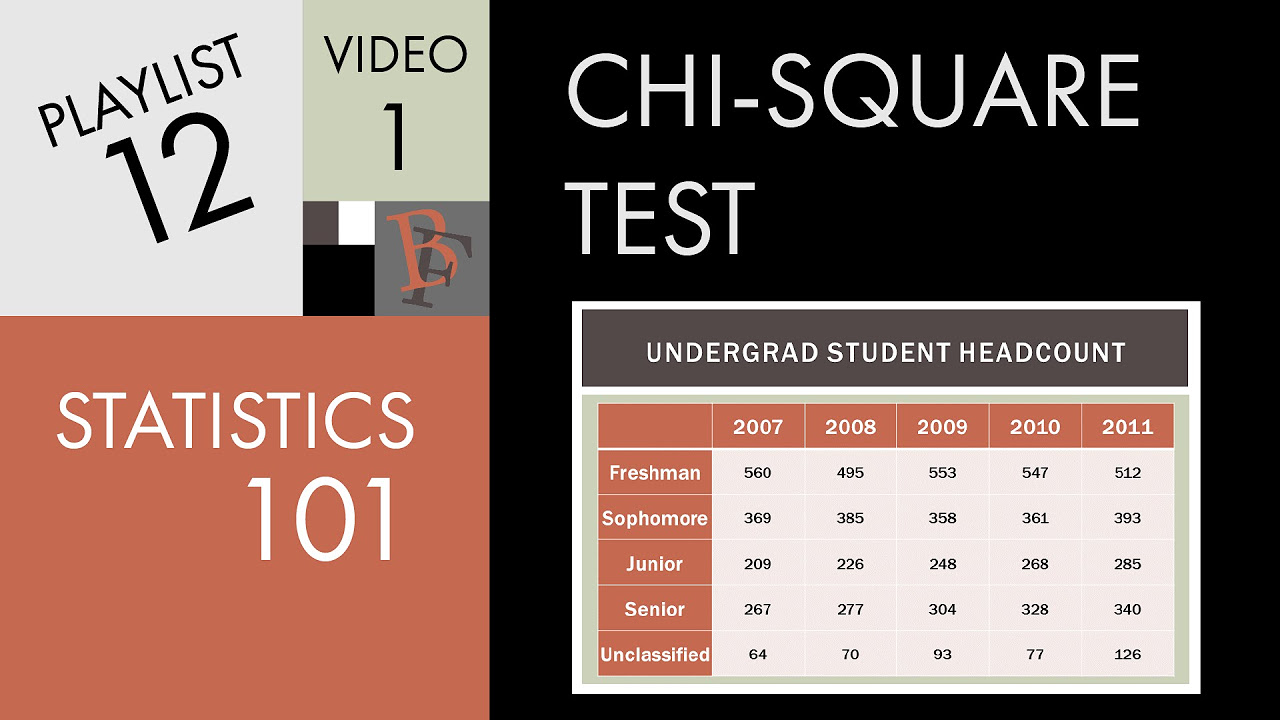
Statistics 101: Chi-square in Excel using College Enrollment Data

Chi-square distribution introduction | Probability and Statistics | Khan Academy
Statistics 101: Introduction to the Chi-square Test
5.0 / 5 (0 votes)
Thanks for rating: