Introduction to Effect Size
TLDRThis script delves into the concept of effect size, distinguishing it from P values which measure statistical significance. It introduces two primary types of effect size: the correlation coefficient (R) and Cohen's D. The correlation coefficient (R) illustrates the strength of a relationship between variables, like the impact of training hours on employee politeness versus problem-solving skills. Cohen's D measures the magnitude of difference between two groups, such as the effectiveness of different leadership training programs. The script explains how these effect sizes are classified into small, medium, and large categories and how they can be converted between R and D for comparative analysis, emphasizing their importance in understanding the practical significance of research findings.
Takeaways
- 📊 **Effect Size Importance**: Discusses the significance of effect size over P values in determining the magnitude of an effect or difference between variables.
- 🔢 **Correlation Coefficient (R)**: Introduces the Pearson correlation coefficient as a measure of effect size that indicates the strength of a relationship between two variables.
- ⏱️ **Training Example**: Uses the example of employee training to illustrate how correlation coefficients can measure the impact of training time on different skills.
- 📉 **Effect Size Comparison**: Shows how to compare the effect size of different skills by looking at the correlation coefficients (0.75 for politeness vs. 0.23 for problem-solving).
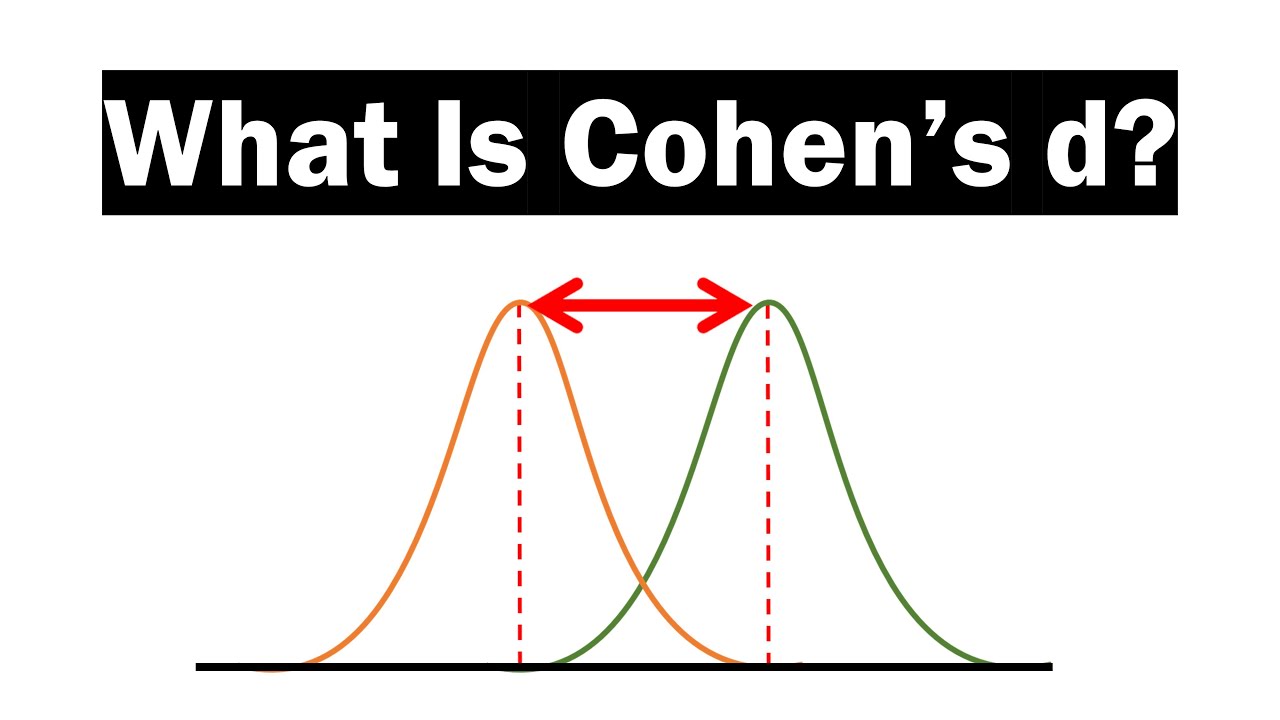
- 🟥🟩 **Cohen's D**: Explains Cohen's D as a measure of effect size that quantifies the difference between two groups, such as in leadership training outcomes.
- 📐 **Standard Deviation Units**: Clarifies that Cohen's D is measured in units of standard deviation, providing a standardized way to compare differences between groups.
- 🔍 **Effect Size Interpretation**: Describes how to interpret Cohen's D values, with small (0.20), medium (0.50), and large (0.80) effect sizes indicating the practical significance of the difference.
- 🔄 **Conversion Between R and D**: Highlights the ability to convert between R and D, allowing for comparison of effects measured in different scales.
- 🧩 **Meta-Analysis Application**: Mentions the use of effect sizes in meta-analyses to combine and compare the findings of multiple studies.
- 📈 **Average Improvement**: Notes that training typically leads to average improvement rather than turning individuals into superstars, emphasizing the practicality of effect sizes.
- 📋 **Effect Size Classification**: Provides a classification system for effect sizes (small, medium, large) to estimate how noticeable changes or differences are in real-world applications.
Q & A
What is the primary difference between P values and effect size?
-P values indicate the probability that an observed effect is due to chance, and they tell us whether an effect is statistically significant. Effect size, on the other hand, measures the magnitude of the effect, showing how large the difference is or how strong the relationship is between variables.
What is the correlation coefficient (R) and how does it relate to effect size?
-The correlation coefficient (R) is a measure of effect size that quantifies the strength and direction of a linear relationship between two variables. The closer the absolute value of R is to 1, the stronger the relationship; an R close to 0 indicates little to no linear relationship.
How does the example of employees undergoing a training program illustrate the concept of effect size?
-The example shows that the amount of time spent in training (X) correlates with two different skills (Y1 and Y2). Politeness (Y1) has a strong correlation with training time, while problem-solving (Y2) has a weaker correlation. This demonstrates that training has a larger effect on politeness than on problem-solving ability.
What is Cohen's D and how is it calculated?
-Cohen's D is a measure of effect size that represents the standardized difference between two group means. It is calculated by taking the difference between the means of two groups, then dividing by the pooled standard deviation of the samples.
How does the size of Cohen's D indicate the magnitude of an effect?
-Cohen's D is measured in units of standard deviation. A small effect size might be around 0.2, a medium effect size around 0.5, and a large effect size around 0.8 or higher. The larger the value of D, the greater the difference between the groups.
What are the traditional classifications for the sizes of effect in terms of R and D values?
-Traditionally, an R of 0.1 or a D of 0.2 is considered a small effect size, an R of 0.3 or a D of 0.5 is a medium effect size, and an R of 0.5 or a D of 0.8 is a large effect size.
Why is it useful to convert between R and D when comparing effects of different studies?
-Converting between R and D allows for a standardized comparison of effect sizes across different studies, even when the original studies used different metrics. This is particularly useful in meta-analyses, where the overall effect size from multiple studies is combined and averaged.
What is the significance of understanding effect size in research and statistics?
-Understanding effect size is crucial because it provides insight into the practical significance of findings, not just their statistical significance. It helps researchers and practitioners determine whether an observed effect is meaningful and substantial enough to have real-world implications.
How might the effect size influence the interpretation of training programs in a workplace?
-The effect size can indicate how much impact a training program has on various skills or outcomes. A large effect size suggests significant improvement in skills due to training, which might lead to changes in training strategies or increased investment in the program.
What is the role of normal distribution in the context of comparing two groups' performance after training?
-Normal distribution is the expected pattern of ratings for individuals in both groups. It accounts for the variability in individual performances, with some individuals rated very high and others very low. This variability is taken into account when calculating the effect size to determine the average improvement due to training.
Can you provide an example of how effect size might be used in a real-world scenario outside of training programs?
-Effect size can be used in various scenarios to measure the impact of interventions or treatments. For instance, in healthcare, it could measure the effectiveness of a new medication compared to a placebo. In education, it could indicate the impact of a new teaching method on student performance.
What are some limitations of relying solely on P values without considering effect size?
-Relying solely on P values can lead to the misinterpretation of results. A statistically significant P value does not necessarily mean a large or meaningful effect. Small effect sizes can be statistically significant with large sample sizes, which might not be practically significant. Ignoring effect size can result in overestimating the importance of findings.
Outlines
📊 Understanding Effect Size: Beyond P Values
This paragraph introduces the concept of effect size as a measure of the magnitude of an effect, distinct from P values which indicate the probability of a relationship or difference between groups. It emphasizes the importance of understanding not just if there is a relationship (significance), but how strong that relationship is (effect size). The paragraph uses the example of employees undergoing a training program to illustrate how effect size can be measured through the correlation coefficient (R). It explains how the correlation coefficient can indicate the strength of the relationship between the amount of training and the development of specific skills, such as politeness and problem-solving ability. The example demonstrates that while politeness is strongly correlated with training hours, problem-solving ability is less so, indicating a larger effect size for the former skill.
📈 Cohen's D: Measuring the Effect Size Between Groups
The second paragraph delves into another type of effect size measurement, Cohen's D, which quantifies the difference between two groups. It uses the scenario of leaders undergoing different types of leadership training and being rated by their employees to illustrate how Cohen's D can be calculated. The paragraph explains that Cohen's D is measured in units of standard deviation, providing a standardized way to compare the magnitude of differences between groups. It also discusses how effect sizes are typically classified into small, medium, and large categories, with specific ranges for R and D values corresponding to each category. The conversion between R and D is mentioned, highlighting the ability to compare effects across different studies or measurements. The paragraph concludes by emphasizing the utility of effect size measurements in meta-analyses, where multiple studies are combined to determine an overall effect.
Mindmap
Keywords
💡Effect Size
💡P Value
💡Correlation Coefficient (R)
💡Pearson Correlation Coefficient
💡Cohen's D
💡Standard Deviation
💡Leadership Training
💡Normal Distribution
💡Meta-Analysis
💡Small, Medium, and Large Effect Sizes
Highlights
Introduction to the concept of effect size as a measure of the magnitude of an effect, as opposed to P values which indicate significance.
Explanation of how effect size differs from P values, focusing on the size of the difference or strength of the relationship rather than just statistical significance.
Introduction of the correlation coefficient R as the first type of effect size discussed.
Example given about employees' training programs and the correlation between time spent in training and skill level, specifically politeness and problem-solving ability.
Illustration of how the correlation coefficient R indicates the strength of the relationship between training hours and the two skills, with politeness having a stronger correlation.
Definition of Cohen's D as the second type of effect size discussed, which measures the difference between two groups.
Example of leadership training where two groups are compared after several months to determine the effectiveness of different training methods.
Explanation of how Cohen's D is calculated by taking the difference between two group means and standardizing it by the pooled standard deviation.
Visualization of different Cohen's D values and their impact on the distribution of group ratings, with higher values indicating a larger effect size.
Classification of effect sizes into small, medium, and large categories based on the values of R and D.
Description of small effect sizes with R of 0.10 or D of 0.20, indicating subtle differences that may not be easily noticeable.
Medium effect sizes defined as noticeable and significant, with R values around 0.3 or D values around 0.5.
Large effect sizes characterized by substantial differences, with R values around 0.5 or D values around 0.8.
Conversion of Cohen's D to the correlation coefficient R and vice versa, allowing for comparison of effects across different studies.
Importance of effect size in meta-analyses, where studies are combined and their effects are averaged to determine the overall impact.
Practical application of effect size in understanding the real-world implications of training programs and interventions.
Summary of the two main types of effect sizes, R and D, and their role in measuring the strength of a relationship or difference between variables.
Transcripts
Browse More Related Video


5.0 / 5 (0 votes)
Thanks for rating: